

TL;DR
- 46% of global workers name work-life balance as a key reason to stay with an employer, versus 23% for pay (Randstad Workmonitor, 2026).
- US full-time employees worked an average of 8.1 hours per workday and 34.2 hours per week in private industry (Bureau of Labor Statistics, 2025).
- Americans are offered about 12 vacation days a year, the fewest of any country surveyed, compared with 31 in France and 29 in Germany (Expedia Vacation Deprivation study, 2024).
- 745,000 deaths a year worldwide are attributed to working 55 or more hours a week (World Health Organization and ILO, 2016 data).
- 72% of US employees report moderate-to-very-high workplace stress, a multi-year high (Aflac WorkForces Report, 2025).
- 40% of workers would start job-hunting, and 5% would quit outright if their flexibility were taken away (Owl Labs, 2025).
- In the UK four-day-week pilot, 71% of employees reported lower burnout, and 92% of companies kept the schedule (University of Cambridge, 2022-2023).
- 46% of US workers with paid time off take less than they are offered (Pew Research Center, 2023).
In this article
Presented by WorkTime
WorkTime is privacy-conscious employee monitoring software that delivers detailed workforce insights without capturing screenshots, screen recordings, or personal content.
Work-life balance vs. pay: what workers prioritize
Work-life balance has become the top reason people stay in a job, even though pay is still the top draw for taking one. In the Randstad Workmonitor, 46% of global workers cite work-life balance as a key retention factor, compared with 23% who cite pay, in 2026 data, while pay remains the top attractor for 81% of workers.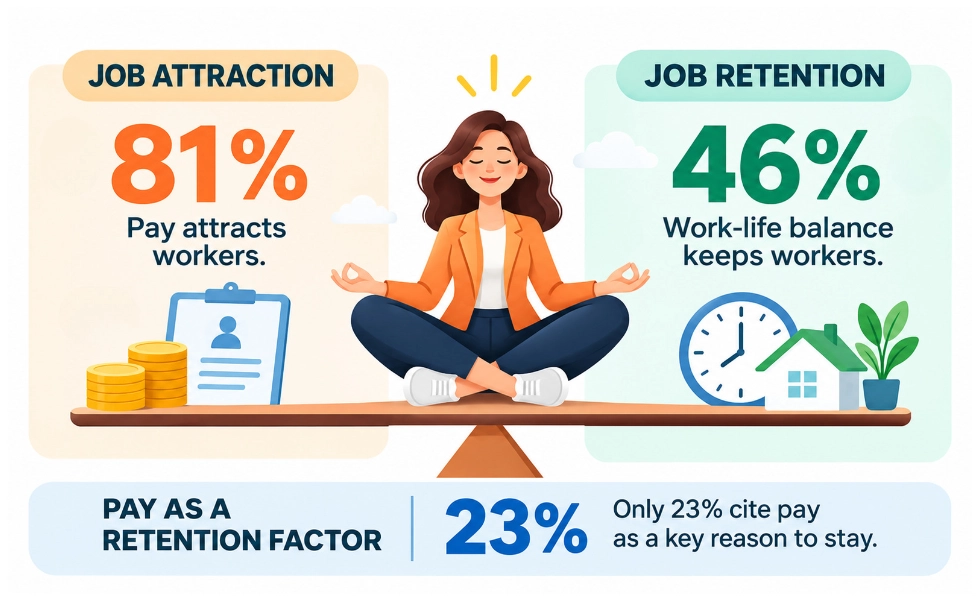
| Finding | Value | Population | Source |
|---|---|---|---|
|
Rank work-life balance as top motivator |
28% |
US employees (2025) |
|
|
Rank compensation as top motivator |
27% |
US employees (2025) |
SurveyMonkey |
|
Gen Z calling balance the most important job aspect |
32% |
US Gen Z (2025) |
SurveyMonkey |
|
Say well-being is as important as salary |
88% |
Employees, 9 countries (2025) |
|
|
Will only consider a well-being-first employer |
89% |
Employees, 9 countries (2025) |
Wellhub |
Work-life balance trends over time
Working hours have barely moved in 20 years, even as remote work retreated from its 2020 peak and job satisfaction climbed to a record. The average US private-sector workweek comes from a single continuous Bureau of Labor Statistics series hosted on FRED:| Year | US average weekly hours, private sector |
|---|---|
|
2006 |
34.5 |
|
2019 |
34.3 |
|
2020 |
34.8 |
|
2023 |
34.4 |
|
2025 |
34.2 |
| Metric | Earlier | Recent | Source |
|---|---|---|---|
|
Remote-capable US workers who work from home all the time |
55% (Oct 2020) |
35% (Mar 2023) |
|
|
US workers satisfied with their jobs |
42.6% (2010) |
69% (2026) |
The Conference Board |
|
US employees "thriving" in life |
60% (2017-19) |
51% (2025) |
|
|
US workers with access to paid leave |
66% (2017-18) |
71% (2024-25) |
|
|
Average remote days per week (college-educated, 40 countries) |
1.6 (2022) |
1.27 (2024-25) |
How many hours Americans actually work
US full-time employees worked an average of 8.1 hours per workday in 2025, per the BLS American Time Use Survey. Globally, 9% of workers put in 55 or more hours a week (World Health Organization and ILO, 2016 data), and more than a third work 48 or more hours a week (International Labour Organization, 2023).| Measure | Value | Population | Source |
|---|---|---|---|
|
Average hours worked per workday |
8.1 hours |
US full-time employed (2025) |
BLS ATUS |
|
Average weekly hours, private sector |
34.2 hours |
US private employees (2025) |
BLS ATUS |
|
Share working on an average weekday/hours worked |
81% / 8.02 hours |
US employed (2025) |
BLS ATUS |
|
Share working on an average weekend day/hours worker |
30% / 5.41 hours |
US employed (2025) |
BLS ATUS |
|
Full-time average workday |
8.15 hours |
US full-time (2023) |
BLS ATUS |
|
Part-time average workday |
5.28 hours |
US part-time (2023) |
BLS ATUS |
|
Average paid workweek, North America (shortest region) |
37.9 hours |
North America (2023) |
ILO |
|
Global share working 48+ hours a week |
more than 33% |
Global (2023) |
ILO |
|
Global share working 55+ hours a week |
9% |
Global (2016) |
WHO and ILO |
Work-life balance by country: US vs. the world
The United States ranks 29th of 41 countries on the OECD's work-life balance measures, and roughly 10% of US employees work very long hours (50 or more per week). The OECD Better Life Index shows wide national gaps in that share: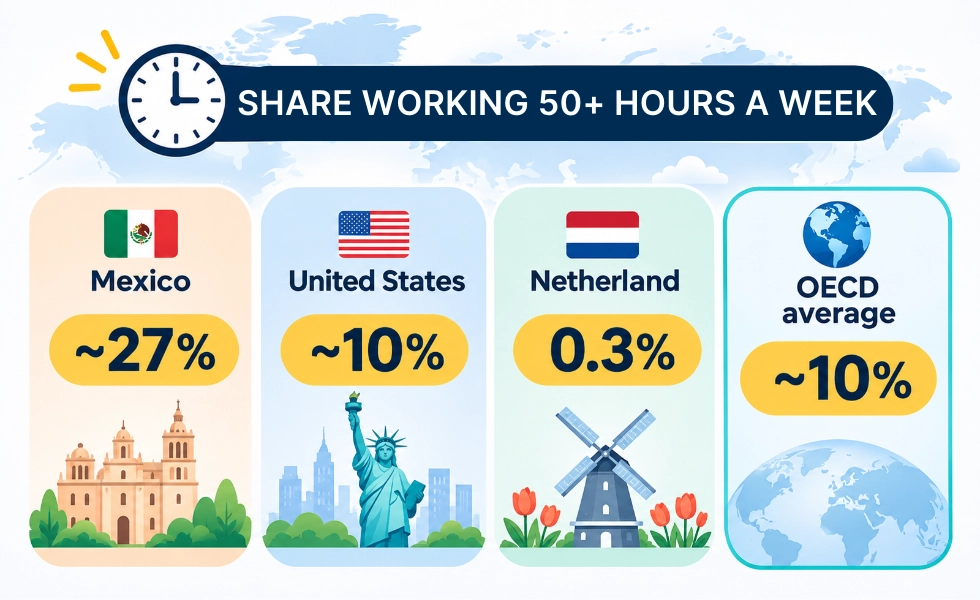
| Vacation measure | Value | Source |
|---|---|---|
|
Vacation days offered, US (fewest surveyed) |
~12 days |
Expedia, 2024 |
|
Vacation days, France |
31 days |
Expedia (2024) |
|
Vacation days, Germany |
29 days |
Expedia (2024) |
|
Americans feeling vacation-deprived |
65% |
Expedia (2024) |
|
Global workers feeling vacation-deprived |
62% |
Expedia (2024) |
Work-life balance by generation
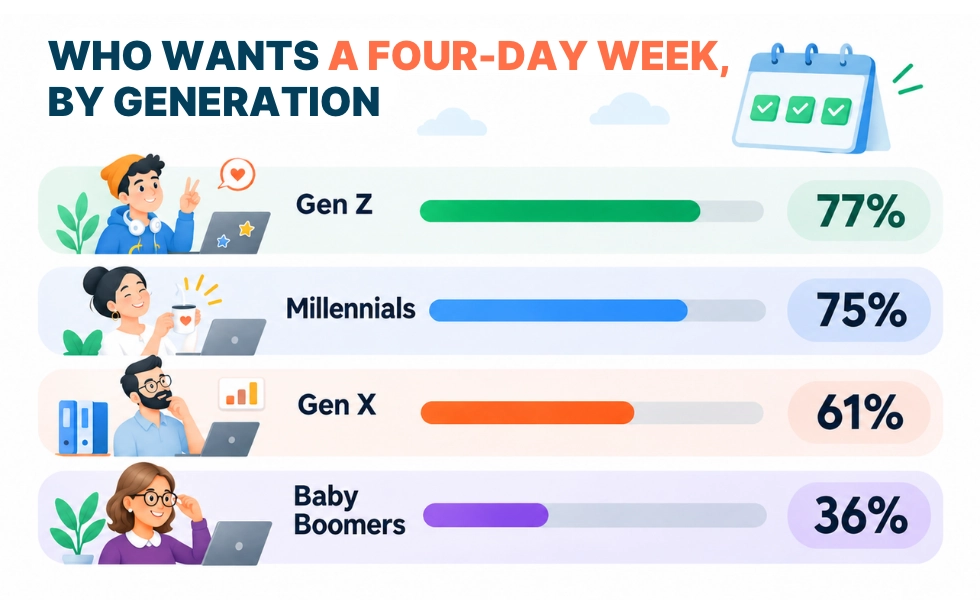
Younger workers place the highest value on balance and report the most strain. Gen Z is now the most burned-out generation in the US workforce, at 74%, ahead of Millennials at 66%, per the , 2025.| Generation | Most burned out (Aflac) | Want a four-day week (Owl Labs) | Would trade pay for flexible hours (Owl Labs) | Want more focus on flexibility (SurveyMonkey) |
|---|---|---|---|---|
|
Gen Z |
74% |
77% |
78% |
41% |
|
Millennials |
66% |
75% |
73% |
38% |
|
Gen X |
n/a |
61% |
57% |
29% |
|
Baby Boomers |
n/a |
36% |
29% |
23% |
- Year-over-year stress rose for 55% of Gen Z and 56% of Millennials, against 47% of Gen X and 38% of Boomers, among workers in 10 countries (Wellhub, 2026).
- 41% of Gen Z and 46% of Millennials name work-life balance as a barrier to taking on a leadership role across a 44-country survey, and digital fatigue affects 58% of Gen Z and 54% of Millennials (Deloitte Gen Z and Millennial Survey, 2026).
Work-life balance by gender
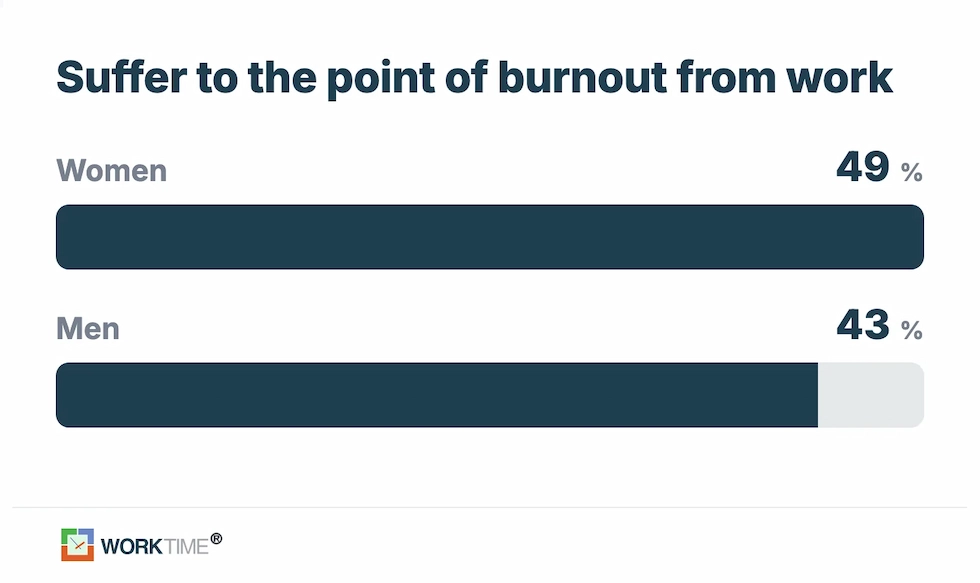
Men and women report work-life balance differently, starting with hours worked: US men worked 8.24 hours a day against 7.86 hours for women in full-time jobs, while women were more likely to work from home (38%) than men (31%), per BLS time-use data (2025).| Finding | Women | Men | Source |
|---|---|---|---|
|
Suffer to the point of burnout from work |
49% |
43% |
|
|
Would likely leave a job if remote work ended |
49% |
43% |
Pew Research Center, 2024 |
|
Average hours worked per workday (full-time) |
7.86 hours |
8.24 hours |
BLS ATUS (2025) |
|
Childcare time per day (children under six) |
2.73 hours |
1.83 hours |
BLS ATUS (2023) |
Work-life balance for working parents
Remote work helps parents less than its reputation suggests, and most parents cannot access it at all. Only 35% of US working parents hold a job that can be done from home; 65% cannot work remotely, per Pew Research Center, 2026.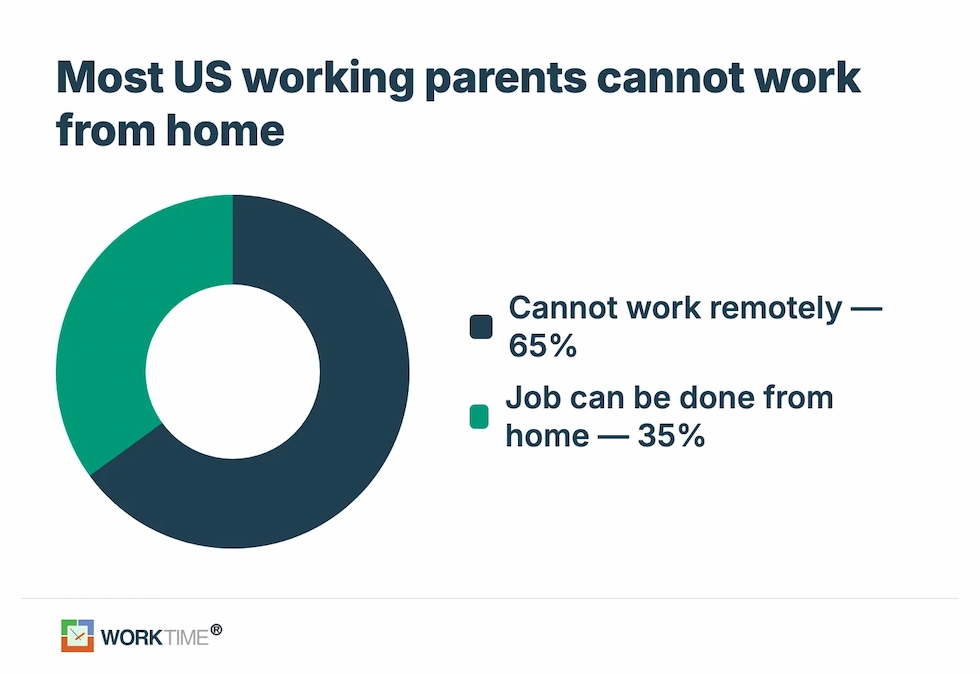
- Parents who work from home and parents who work on-site report similarly high difficulty balancing work and family, so remote work does not substantially ease the strain (Pew, 2026).
- 39% of parents who work from home most of the time handle parenting tasks "extremely" or "very" often while working, compared with 25% who rarely work from home (Pew, 2026).
- US women with children under 18 are more likely to stay in a role for its balance than women without children, 37% against 33% (SurveyMonkey and CNBC, 2025).
- Mothers of children under six spend 2.73 hours a day on childcare, compared with 1.83 hours for fathers (BLS, 2023).
Remote, hybrid, and on-site: the balance gap
Most remote-capable employees now split their week between home and office, and they credit that arrangement for their balance. Among US remote-capable employees, 52% work hybrid, 26% work fully remote, and 22% are fully on-site (Gallup, 2025). New hiring still leans heavily on-site.| Arrangement | Share of remote-capable employees | Share of new US job postings |
|---|---|---|
|
Hybrid |
52% |
10% |
|
Fully remote |
26% |
3% |
|
Fully on-site |
22% |
87% |
- 71% of people who work from home at least sometimes say it helps their work-life balance, with 52% saying it helps "a lot" (Pew Research Center, 2023).
- 57% of employees on low-quality schedules say work conflicts with their personal life, compared with 39% on high-quality schedules (Gallup Work Schedules study, 2025).
- 63% of hybrid workers have employer-mandated office days (Pew Research Center, 2023).
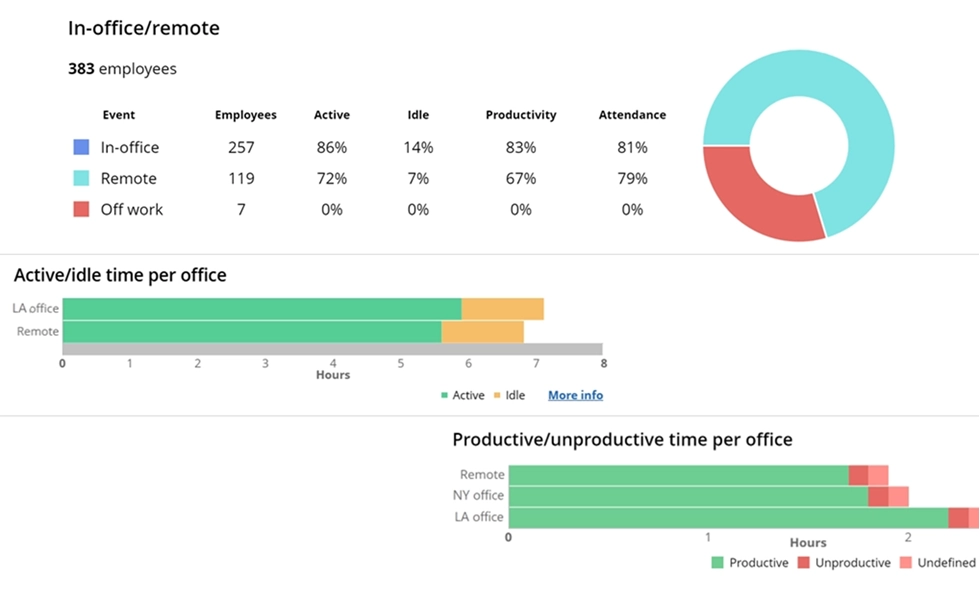
Spot differences in work patterns between office-based and remote employees.
Book demo
Evaluate performance across different work environments by reviewing key workforce metrics, including attendance and app usage.
Start free trialFlexibility: what workers want vs. what they get
Workers want more flexibility than employers currently offer, and the gap is a live source of friction. 47% of workers say they do not have the level of flexibility they want, and 37% would not accept a job without flexible hours, per Owl Labs (2025).| Finding | Value | Source |
|---|---|---|
|
Want flexible locations |
76% |
Ipsos, 2021 |
|
Want flexible hours |
76% |
Ipsos (2021) |
|
Had a flexible schedule |
57% |
BLS job-flexibilities module (2024-25) |
|
Could take an hour or two off without difficulty |
69% |
BLS job-flexibilities module (2024-25) |
|
Knew their schedule four or more weeks ahead |
59% |
BLS job-flexibilities module (2024-25) |
|
Employers offering hybrid work (down from 57%) |
54% |
SHRM, 2026 |
|
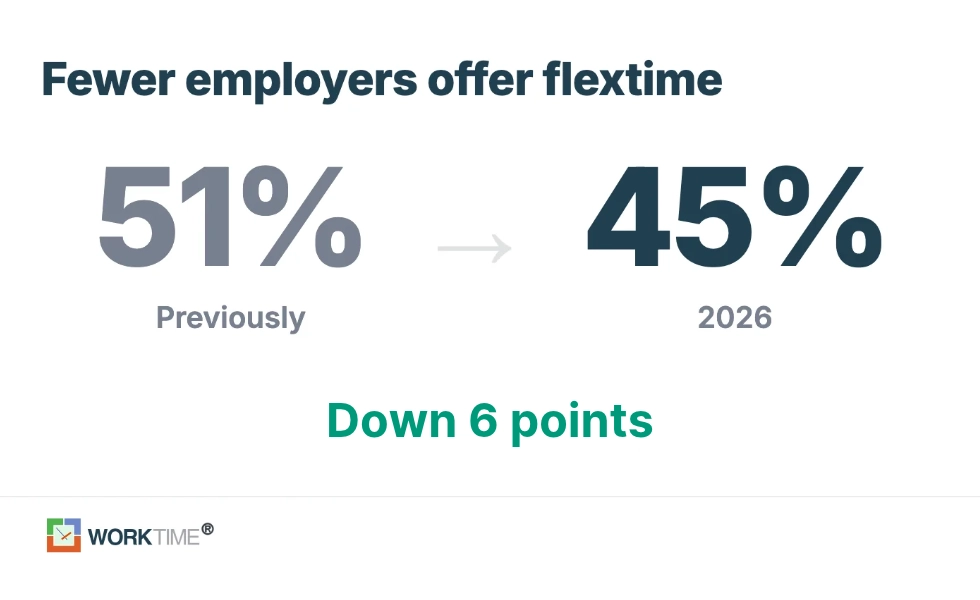
Employers offering flextime (down from 51%) |
45% |
SHRM (2026) |
Always-on culture and after-hours work
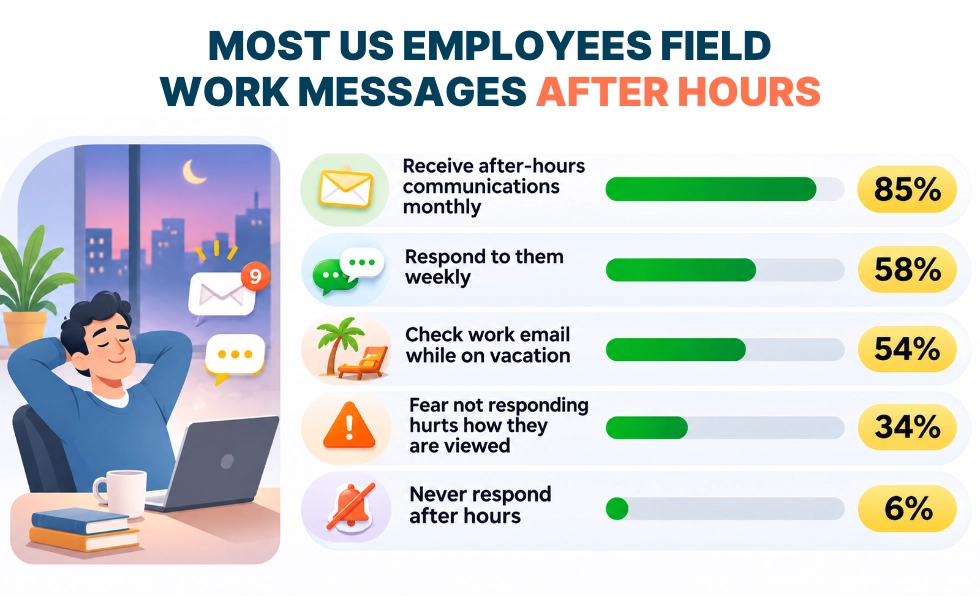
Most employees now field work messages outside working hours, and many feel they cannot ignore them. 85% of US employees receive work-related communications outside standard hours at least a few times a month, per SurveyMonkey, 2025.| Behavior | Value | Population | Source |
|---|---|---|---|
|
Receive after-hours work communications monthly |
85% |
US employees (2025) |
SurveyMonkey |
|
Respond to after-hours communications weekly |
58% |
US employees (2025) |
SurveyMonkey |
|
Never respond after hours |
6% |
US employees (2025) |
SurveyMonkey |
|
Fear not responding hurts how they are viewed |
34% |
US employees (2025) |
SurveyMonkey |
|
Check work email while on vacation |
54% |
US employees (2025) |
SurveyMonkey |
|
Messages sent or received outside core hours |
50+ per day |
M365 users, global (2025) |
|
|
Rise in meetings held after 8 p.m. |
up 16% year over year |
M365 users, global (2025) |
Microsoft Work Trend Index |
|
Back in their inbox by 10 p.m. |
29% |
M365 users, global (2025) |
Microsoft Work Trend Index |
|
Emails and chat messages handled per day |
117 emails, 153 messages |
M365 users, global (2025) |
Microsoft Work Trend Index |
Paid time off and unused vacation
Americans leave paid time off on the table even when they have it. 46% of US workers with paid time off take less than they are offered, per Pew Research Center, 2023| Finding | Value | Population | Source |
|---|---|---|---|
|
Take less PTO than offered |
46% |
US workers with PTO (2023) |
Pew Research Center |
|
Do not feel they need more time off |
52% |
US workers with PTO (2023) |
Pew Research Center |
|
Worry about falling behind |
49% |
US workers with PTO (2023) |
Pew Research Center |
|
Feel bad about the load on coworkers |
43% |
US workers with PTO (2023) |
Pew Research Center |
|
Skip time off out of fear of losing their job |
21% Black vs. 13% White |
US workers with PTO (2023) |
Pew Research Center |
|
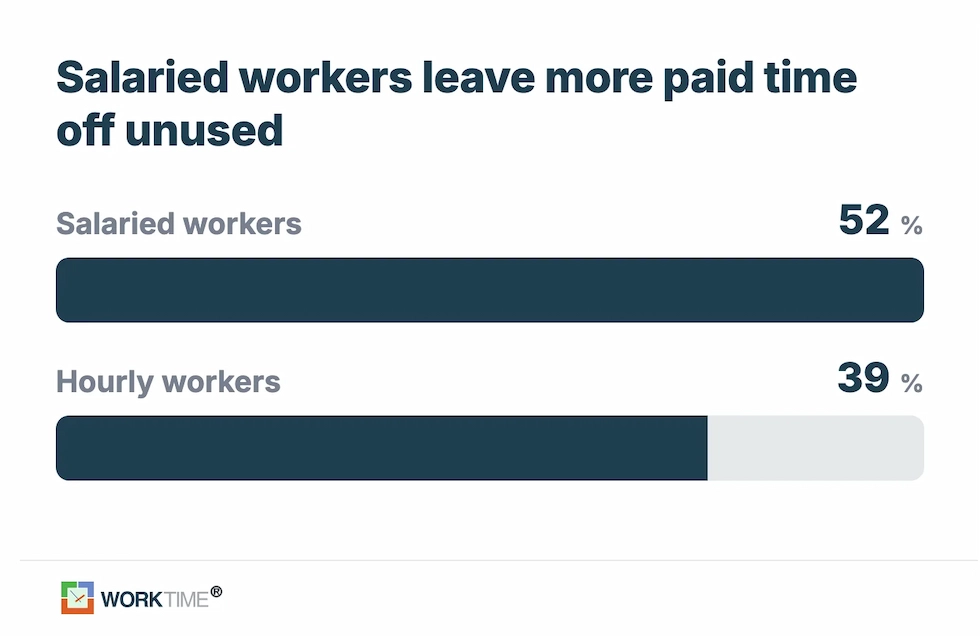
Salaried vs. hourly leaving PTO unused |
52% vs. 39% |
US workers with PTO (2023) |
Pew Research Center |
|
Have access to paid leave |
71% |
US wage and salary workers (2024-25) |
BLS job-flexibilities module |
Paid leave and balance by industry and occupation
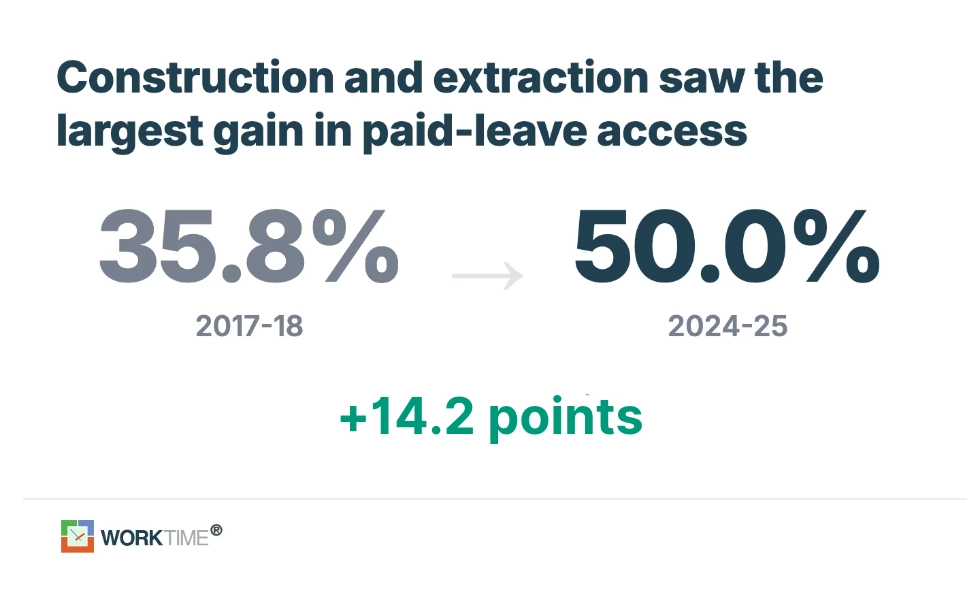
Access to paid leave, the foundation of any balance, varies sharply by occupation. Management and professional workers are far more likely to have it than service and construction workers, per the BLS job-flexibilities module (2024-25).| Occupation group | Paid-leave access |
|---|---|
|
Management, business, and financial |
89.5% |
|
Professional and related |
80.3% |
|
Installation, maintenance, and repair |
77.5% |
|
Production |
73.4% |
|
Office and administrative support |
70.8% |
|
Transportation and material moving |
65.7% |
|
Sales and related |
61.4% |
|
Construction and extraction |
50.0% |
|
Service |
44.9% |
Paid leave access by company size
Workers at small employers get less paid leave than those at large ones, across every leave type, per BLS Employee Benefits Survey data.| Leave type | Small employers | Large employers |
|---|---|---|
|
Paid sick leave |
73% (1-49 workers) |
90% (500+ workers) |
|
Paid vacation |
70% (1-49 workers) |
82% (500+ workers) |
|
Paid personal leave |
38% (1-49 workers) |
69% (500+ workers) |
|
Paid holidays |
74% (1-99 workers) |
89% (100+ workers) |
Work-life balance by income and wage level
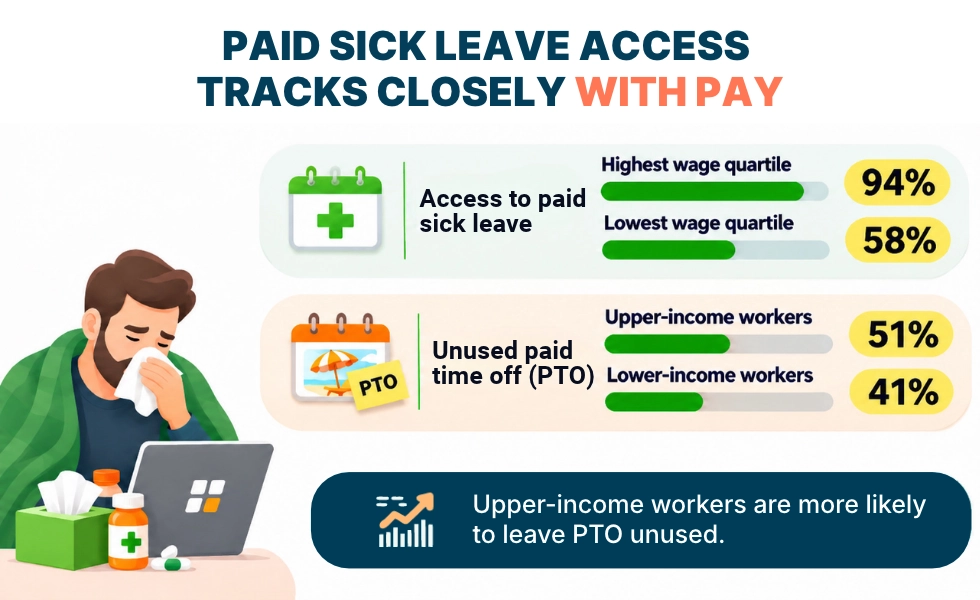
Paid leave and recovery time track closely with pay, so the workers with the least cushion get the least time off. Per BLS Employee Benefits Survey data (2024):| Benefit | Lowest wage quartile | Highest wage quartile |
|---|---|---|
|
Paid sick leave access |
58% |
94% |
|
Paid vacation access |
56% |
93% |
- Among the bottom 10% of earners, only 40% have paid sick leave, compared with 96% of the top 10% (BLS, 2024).
- Job satisfaction runs from 45.3% among workers earning under $25,000 to 76% among those earning $150,000 or more (The Conference Board, 2026).
- Upper-income workers (51%) are more likely than lower-income workers (41%) to leave PTO unused (Pew Research Center, 2023).
- 38% of workers on low-quality schedules are financially struggling, compared with 23% on high-quality schedules (Gallup, 2025).
- 44% of US employees could not cover a $1,000 unexpected medical expense, rising to 54% of Black and 51% of Gen Z workers (Aflac, 2025).
Work-life balance by role and seniority
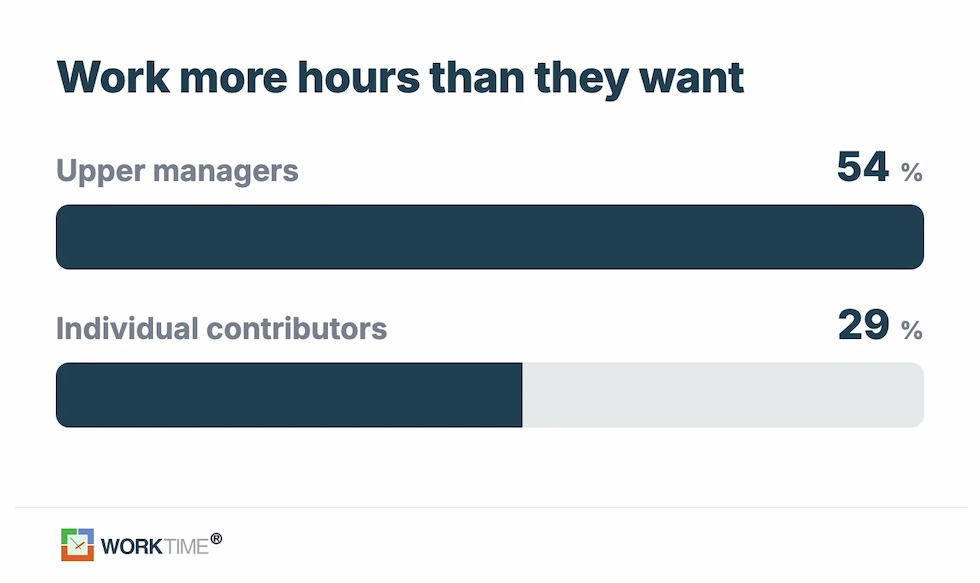
Managers work longer and skip more time off than the people they lead, even as they report more stress from it. Randstad Workmonitor data found that 54% of upper managers work more hours than they want, compared with 29% of individual contributors (2026).| Finding | Managers | Non-managers | Source |
|---|---|---|---|
|
Work more hours than they want |
54% |
29% |
Randstad Workmonitor (2026) |
|
Cite long hours as a major stress source |
65% |
40% |
Randstad Workmonitor (2026) |
|
Leave PTO unused |
54% |
42% |
Pew Research Center (2023) |
|
Believe sacrificing balance is needed for success |
74% |
63% |
SurveyMonkey (2025) |
Burnout and stress statistics
Burnout and stress sit at the center of the work-life balance conversation, and both are high. 72% of US employees report moderate-to-very-high workplace stress, a multi-year high, per the Aflac WorkForces Report (2025).| Finding | Value | Population | Source |
|---|---|---|---|
|
Report moderate-to-very-high workplace stress (multi-year high) |
72% |
US employees (2025) |
Aflac |
|
Experienced burnout symptoms in the past year |
90% |
Employees, 10 countries (2026) |
Wellhub |
|
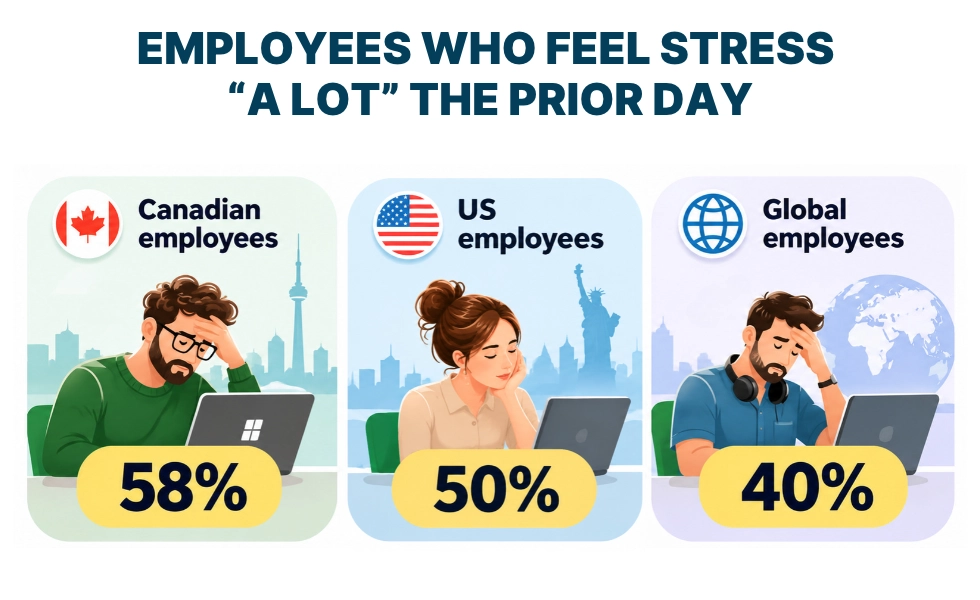
Felt stress "a lot" the prior day |
50% |
US employees (2025) |
Gallup |
|
Felt stress "a lot" the prior day |
40% |
Global employees (2025) |
Gallup |
|
Felt stress "a lot" the prior day |
58% |
Canada employees (2025) |
Gallup |
|
Burnout among workers who feel disconnected vs. those with belonging |
78% vs. 55% |
US employees (2025) |
Aflac |
|
Cite rising living expenses and medical costs as their top stressors |
83% |
US employees (2026) |
The health cost of overwork
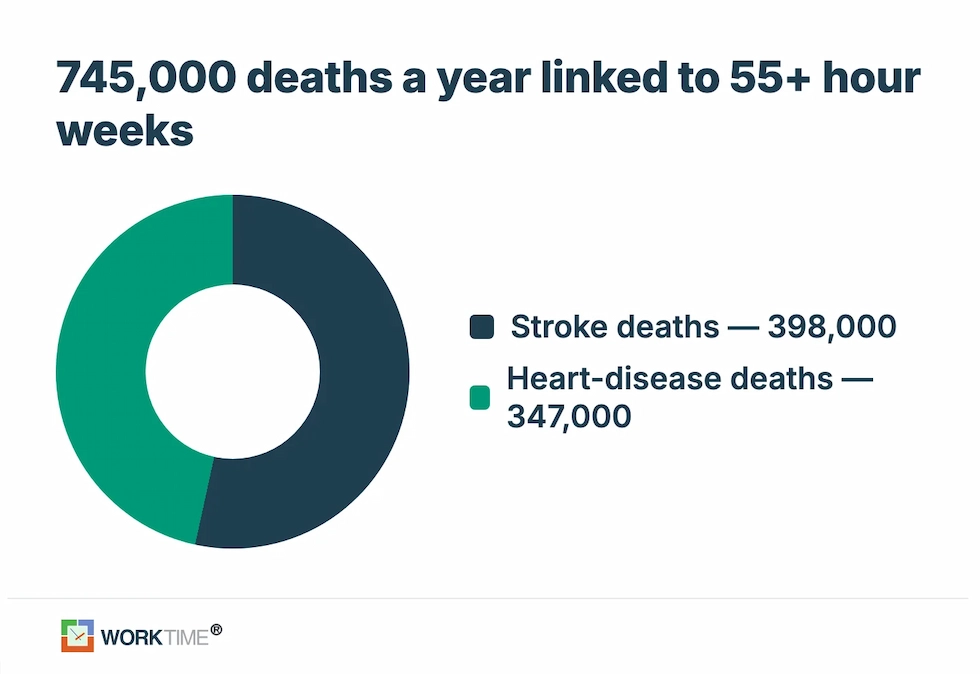
Long hours carry a measured health cost, up to and including death. An estimated 745,000 deaths a year from stroke and heart disease are attributed to working 55 or more hours a week, per the World Health Organization and ILO, whose 2016 figures remain the most recent global estimate.| Measure | Value | Source |
|---|---|---|
|
Annual deaths worldwide from stroke and heart disease linked to 55+ hour weeks |
745,000 |
WHO and ILO (2016) |
|
Stroke deaths linked to long hours |
398,000 |
WHO and ILO (2016) |
|
Heart-disease deaths linked to long hours |
347,000 |
WHO and ILO (2016) |
|
Added stroke risk at 55+ hours a week vs 35-40 |
+35% |
WHO and ILO (2016) |
|
Added heart-disease death risk at 55+ hours a week vs. 35-40 |
+17% |
WHO and ILO (2016) |
|
Rise in work-related deaths from long hours since 2000 |
+29% |
WHO and ILO (2016) |
The four-day workweek: trials and demand
The four-day workweek is the most studied balance intervention, and the trial results are consistent. In the UK pilot of 61 companies and about 2,900 workers run by the University of Cambridge, the outcomes were: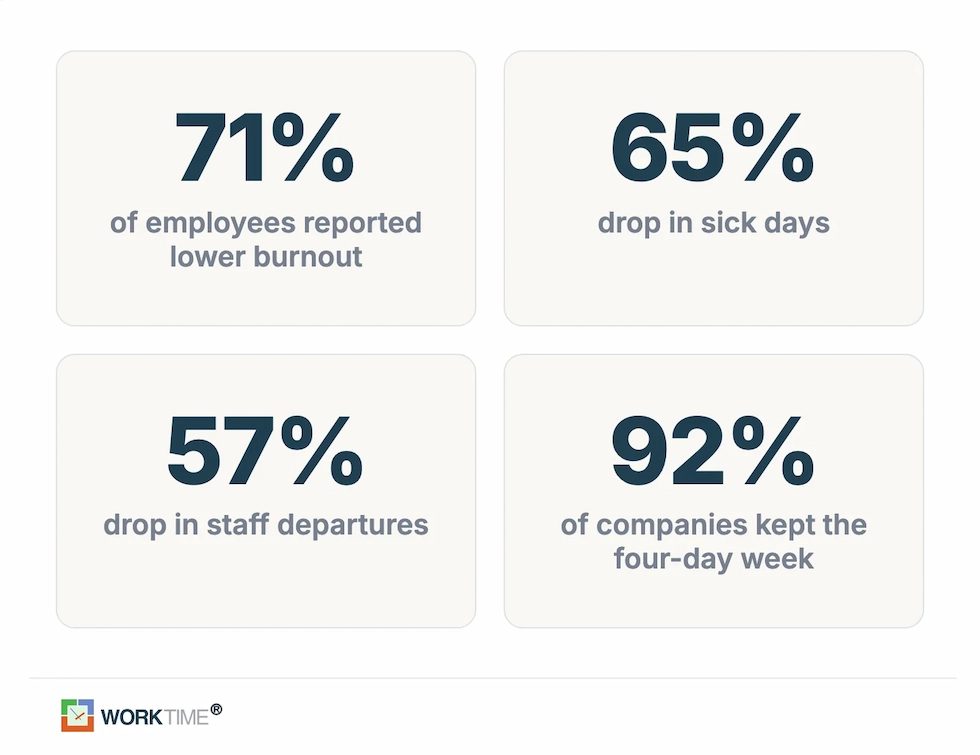
| Finding | Value | Source |
|---|---|---|
|
Support a four-day workweek |
7 in 10 |
Ipsos (2021) |
|
Say a four-day week would improve their well-being |
77% |
Bentley-Gallup, 2023 |
|
US employers offering a four-day week (up from 8%) |
10% |
SHRM (2026) |
|
Salary workers would trade for a shorter week or more flexibility |
8-9% |
Owl Labs (2025) |
Right-to-disconnect laws around the world
A growing list of countries has written the right to ignore work messages after hours into law, though the United States has not. France was the first to codify a right to disconnect, in 2017, for firms with 50 or more employees. Countries with some form of right-to-disconnect rule now include France, Belgium, Italy, Spain, Portugal, Ireland, Greece, Australia, Argentina, Chile, Mexico, and the Canadian province of Ontario.- Australia's right to disconnect took effect on 26 August 2024 for most businesses and 26 August 2025 for small businesses, per the .
- Portugal's 2021 law places the duty on employers not to contact staff after hours, rather than on employees to switch off.
- The EU Working Time Directive caps the average work week at 48 hours and requires 11 consecutive hours of daily rest (European Commission). An EU-wide right-to-disconnect directive is still under negotiation and not yet in force.
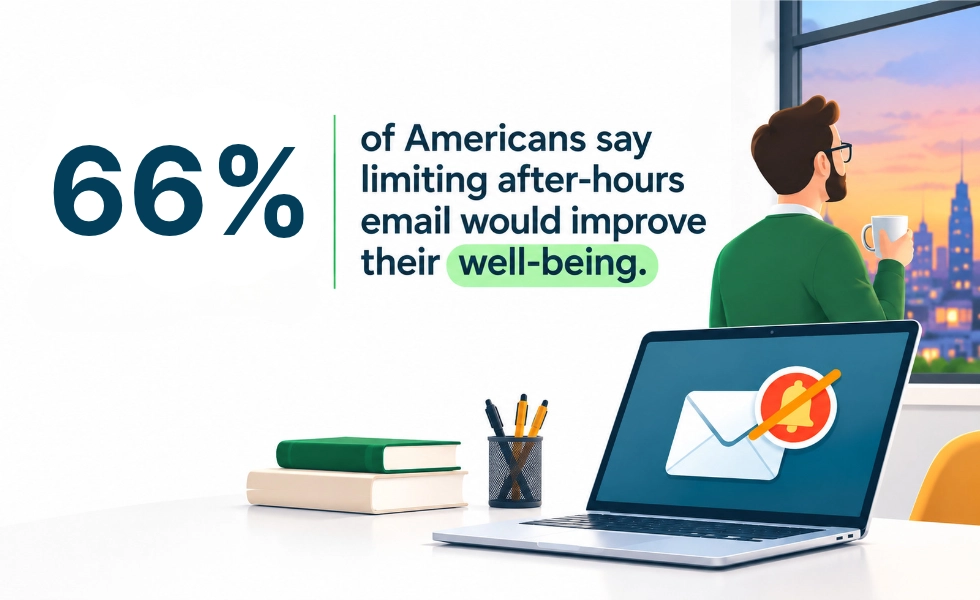
- 66% of Americans say limiting after-hours email would improve their well-being (Bentley-Gallup, 2023).
How many workers quit over work-life balance
Work-life balance and flexibility are now leading reasons people leave, especially when flexible arrangements are threatened. 40% of workers would start job-hunting, and 5% would quit outright if their flexibility were taken away (Owl Labs, 2025).| Finding | Value | Population | Source |
|---|---|---|---|
|
Would job-hunt if flexibility were removed |
40% |
US workers (2025) |
Owl Labs |
|
Would be unlikely to stay if remote work ended |
46% |
US remote-capable (2024) |
Pew Research Center |
|
Fully remote vs. occasional remote who would likely leave |
61% vs. 28% |
US remote-capable (2024) |
Pew Research Center |
|
Cite better balance as a top reason to look for a job |
48% |
US workers (2025) |
Owl Labs |
|
Would consider leaving a non-well-being employer |
83% |
Employees, 9 countries (2025) |
Wellhub |
What poor work-life balance costs employers
Poor balance carries a high, measurable cost through burnout, lost days, and turnover. Burnout-driven productivity loss and turnover cost employers an estimated $322 billion a year globally, up to 20% of payroll (Wellhub, 2025).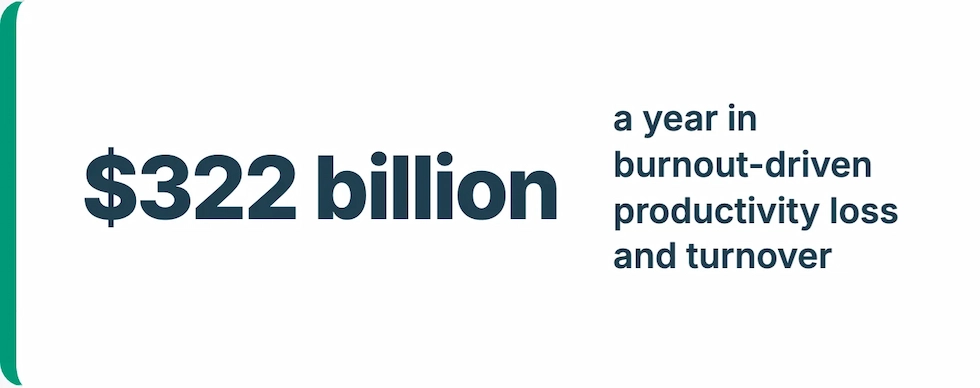
| Measure | Value | Source |
|---|---|---|
|
Annual global cost of burnout-driven productivity loss and turnover |
$322 billion (up to 20% of payroll) |
Wellhub (2025) |
|
Employees engaged globally |
20% |
Conclusion
Work-life balance has become a decision factor on par with pay, and the data explains why. American workers put in some of the longest hours in the developed world, use the fewest vacation days, and field work messages at night more than most. The response is visible in the numbers too: steady demand for flexibility, four-day-week trials that cut burnout without cutting output, and a widening set of countries that have made the right to disconnect law. For employers, the cost of getting this wrong runs into burnout, lost days, and turnover, while the upside of getting it right shows up in retention and engagement. At WorkTime, we provide non-invasive employee monitoring to 9,500+ organizations, tracking workforce productivity, burnout signals, and remote-versus-office balance without screenshots or keystroke logging, so leaders can see where hours and strain are piling up before people leave.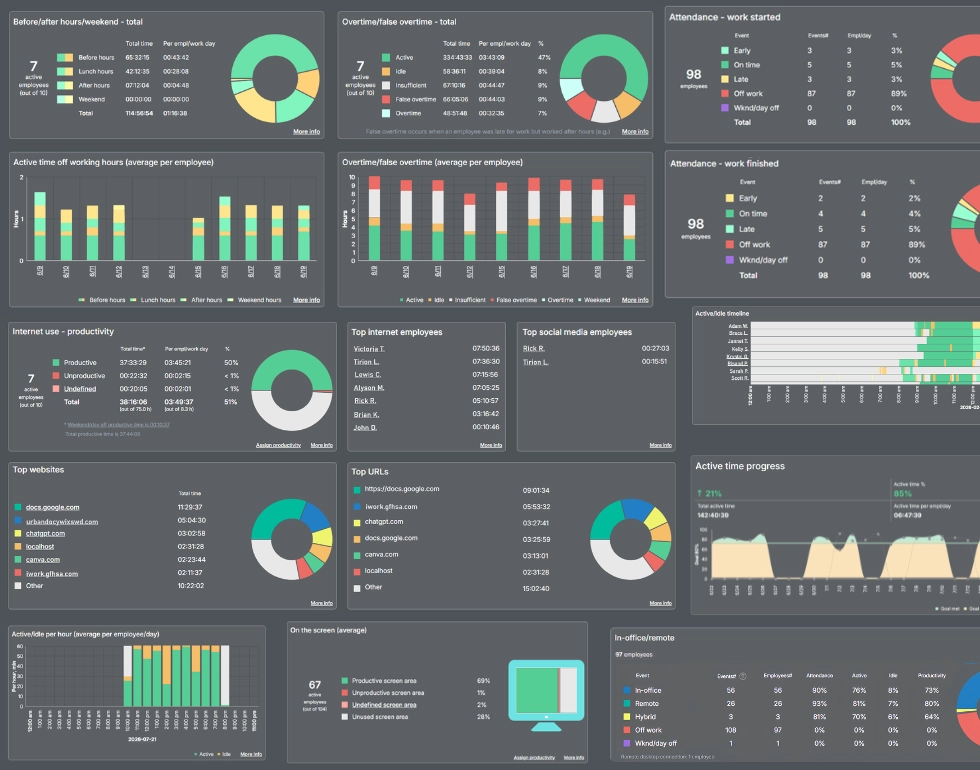
All reports are transparent and privacy-safe, with no personal content captured.
Book demo