



TL;DR
- Turnover is holding steady, not spiking. The government's total separations rate stayed between 3.2% and 3.4% every month of 2025 and sat at 3.4% in June 2026, according to the Bureau of Labor Statistics. The "great resignation" surge has cooled.
- The "average" turnover rate is misleading. SHRM's 2021 benchmarking data puts the median annual turnover rate at 15% but the average at 30%, because a small number of very high-churn employers pull the mean up. Compare yourself to the median inside your own industry.
- Industry is the single biggest driver. Annual rates run from 8.2% in insurance to 26.7% in retail, and hospital staff turnover is 18.5%. A rate that is normal in retail would be a crisis in insurance.
- Seniority predicts churn. Executives turn over at 5.2% a year, while paraprofessional and blue-collar staff leave at 12.5%, based on Mercer's 2025 survey.
- Almost half of it was avoidable. Gallup found that 42% of employees who quit say their manager or organization could have done something to stop them from leaving.
In this article
WorkTime is non-invasive employee monitoring software trusted by 9,500+ organizations. Our productivity and engagement analytics help managers identify early signs of disengagement and turnover, so they can address issues before employees decide to leave.
What is the employee turnover rate?
The employee turnover rate is the percentage of workers who leave an organization over a set period, such as a month, a quarter, or a year. The Bureau of Labor Statistics calls this the "total separations rate," and it is the official measure of turnover for the US labor market. Turnover has two halves:- Voluntary turnover covers people who choose to leave: quits, resignations, and retirements.
- Involuntary turnover covers people the company lets go: layoffs, discharges, and firings. Added together, plus a small "other" category, they make up total separations.

How to calculate employee turnover rate (formula + example)
You calculate the employee turnover rate by dividing the number of employees who left by the average number of employees, then multiplying by 100. The formula:- Pick a time frame (month, quarter, or year).
- Count the employees who left during that period (separations).
- Find your average headcount: add the starting headcount and the ending headcount, then divide by 2.
- Divide separations by average headcount, then multiply by 100.


The current US employee turnover rate (2026)
The current US turnover rate is 3.4% per month, or 13.0% a year for voluntary departures. The monthly figure comes from the government's count of every separation; the annual figure comes from employer surveys of voluntary quits. Here are the current numbers, all seasonally adjusted where noted. 1. The US total separations rate was 3.4% in June 2026. That is the Bureau of Labor Statistics measure of turnover, seasonally adjusted, reported in the Job Openings and Labor Turnover Survey. About 1 in 29 workers separated from a job that month. 2. According to the Bureau of Labor Statistics, 5.4 million total separations were recorded in June 2026. 3. The quit rate was 2.0% in June 2026. Quits are the voluntary share of turnover, covering 3.2 million workers who chose to leave that month, according to the Bureau of Labor Statistics. 4. The layoffs and discharges rate was 1.1% in June 2026, covering 1.8 million workers, per the Bureau of Labor Statistics. Voluntary quits ran at nearly double the rate of involuntary cuts. 5. The hires rate was 3.4% in June 2026, matching the separations rate, as 5.3 million workers were hired. Hiring and leaving are running roughly in balance. 6. The total separations rate held between 3.2% and 3.4% every month of 2025, never moving outside that band, based on the Bureau of Labor Statistics monthly series. Turnover has normalized after the 2021 to 2022 surge. 7. Total separations eased over the past year, down from 5.43 million in June 2025, per the Bureau of Labor Statistics. 8. The average US voluntary turnover rate was 13.0% in 2025. This annual figure comes from Mercer's US Turnover Survey, which excludes retirees, volunteers, and contractors. 9. Mercer's 2025 survey drew on 2,617 US organizations, making it one of the larger employer-reported turnover datasets. 10. The median annual turnover rate is 15%, but the average is 30%, according to SHRM benchmarking data collected in 2021. The gap exists because a few employers with extreme churn pull the average up, which is why the median is the better benchmark.| US turnover rate at a glance | Rate | Vintage | Source |
|---|---|---|---|
|
Total separations rate (monthly) |
3.4% |
June 2026 |
Bureau of Labor Statistics |
|
Quits rate (monthly) |
2.0% |
June 2026 |
Bureau of Labor Statistics |
|
Layoffs and discharges rate (monthly) |
1.1% |
June 2026 |
Bureau of Labor Statistics |
|
Voluntary turnover rate (annual) |
13.0% |
2025 |
Mercer |
|
Overall turnover rate (annual median) |
15% |
2021 |
SHRM |
|
Overall turnover rate (annual average) |
30% |
2021 |
SHRM |
Employee turnover rate by industry
Industry is the single biggest predictor of turnover. Annual rates run from single digits in insurance to the high 20s in retail, so a "high" rate only means something next to your own industry's benchmark. 11. Retail and wholesale have the highest turnover rate at 26.7%, based on Mercer's 2025 US Turnover Survey. 12. Insurance and reinsurance have the lowest turnover rate at 8.2%, per Mercer. That is roughly a third of the retail rate.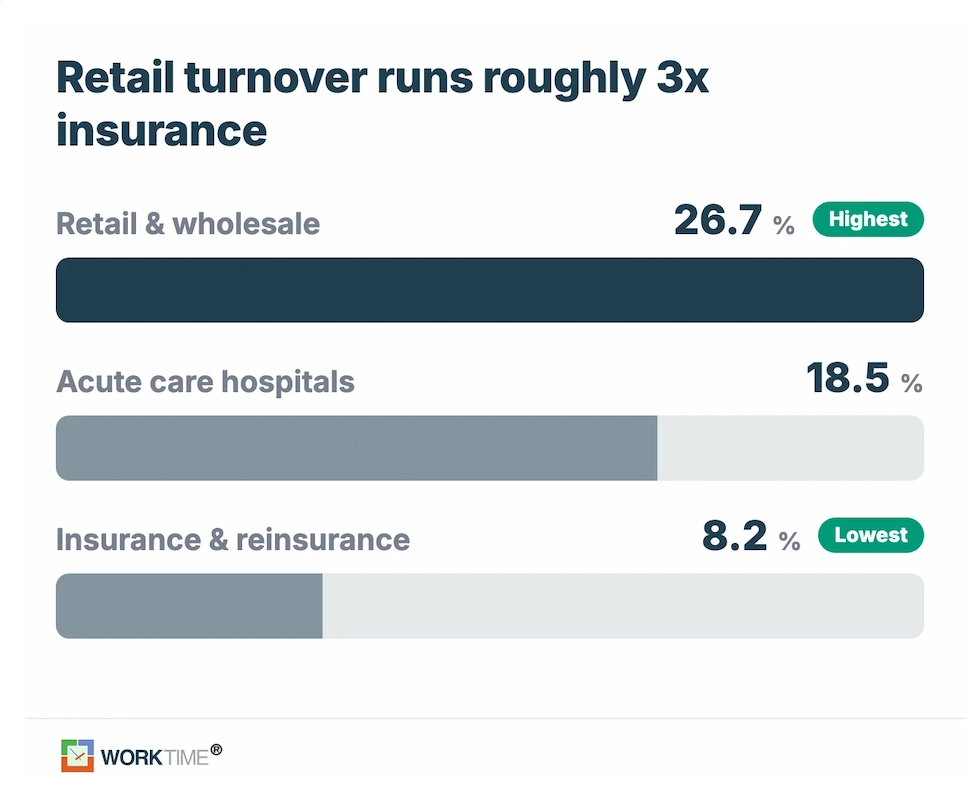
| Broad industry | Turnover rate |
|---|---|
|
Technology (software) |
13.2% |
|
Retail and consumer products |
13.0% |
|
Media and entertainment |
11.4% |
|
Professional services |
11.4% |
|
Government, education, non-profit |
11.2% |
|
Financial services and insurance |
10.8% |
|
Telecommunications |
10.8% |
|
All industries |
10.9% |
| Sub-industry | Turnover rate |
|---|---|
|
Restaurants |
17.2% |
|
Retail |
16.2% |
|
Computer games |
15.5% |
|
Internet |
14.9% |
|
Sporting goods |
14.8% |
|
Computer software |
13.3% |
|
Newspapers |
13.3% |
|
Online media |
13.2% |
|
Sports |
13.2% |
Employee turnover rate by role and seniority
Turnover falls as you move up the organization. Senior, higher-paid roles are the stickiest, and frontline roles churn the most. WorkTime gives managers team-level productivity and activity trends for frontline staff without screenshots, keystroke logging, or screen recording, which matters most in exactly the roles where intrusive monitoring backfires. 17. Significantly, 40.3% of employers reported difficulty hiring or retaining workers for specific roles, showing that the pain concentrates in hard-to-fill positions rather than across the board.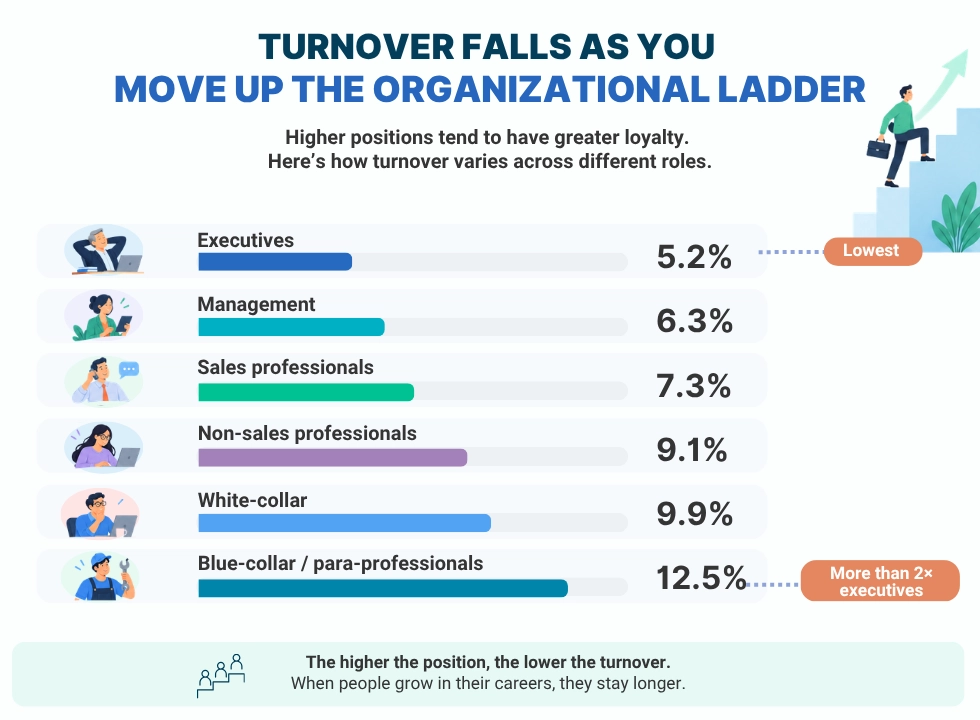
Voluntary vs. involuntary turnover rate
Most turnover is voluntary. Workers leaving by choice consistently outnumber those being laid off or fired, in both the monthly government data and the annual employer surveys. 18. The annual voluntary turnover rate has a median of 12% and an average of 23%, according to SHRM's 2021 benchmarking data. 19. The annual involuntary turnover rate has a median of 4% and an average of 11%. Involuntary turnover is roughly a third the size of voluntary. 20. The overall annual turnover rate has a median of 15% and an average of 30%, combining both types. 21. The quits rate (voluntary) was 2.0% in June 2026 versus a 1.1% layoffs rate (involuntary), per the Bureau of Labor Statistics. Voluntary departures ran at nearly double the involuntary rate. 22. The average voluntary turnover rate was 13.0% in 2025, per Mercer, the current annual benchmark for quits. 23. The promotion rate has a median of 4% and an average of 7%, per SHRM, worth tracking alongside exits to gauge net internal movement.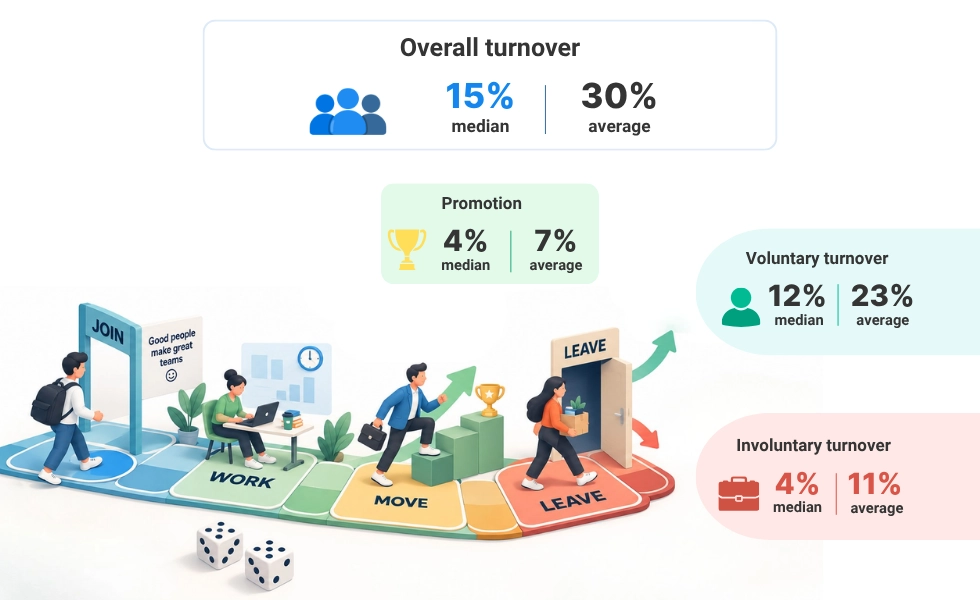
Employee turnover rate trends: year over year
Turnover surged during the 2021 to 2022 "great resignation," then cooled steadily toward pre-pandemic norms. A few sectors ticked back up in 2025, but the broad trend is down from the peak. 24. Voluntary turnover fell from 17.3% in 2023 to 13.5% in 2024 to 13.0% in 2025, per Mercer's year-over-year survey data. The cooling is clear across all three years. 25. Hospital turnover dropped from 25.9% in 2021 to 18.5% in 2025, per NSI's five-year data. 26. Staff RN turnover fell from 27.1% in 2021 to 17.6% in 2025, though 2025 saw a slight uptick from 16.4% in 2024, per NSI. 27. The government's monthly separations rate held flat at 3.2% to 3.4% throughout 2025, per the Bureau of Labor Statistics, confirming a normalized labor market rather than a new surge.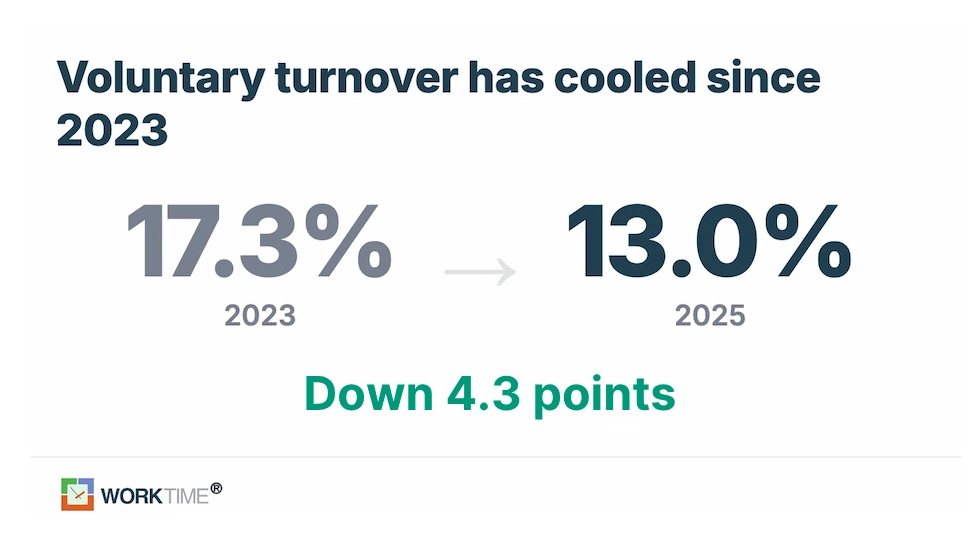
- Voluntary turnover fell in each of the last three years, from 17.3% to 13.5% to 13.0%, per Mercer. The cooling is consistent, not a one-year blip.
- Healthcare has recovered most of its ground but is no longer improving. Hospital turnover dropped 7.4 points from the 2021 peak, then ticked back up in 2025. Staff RN turnover shows the same reversal, rising from 16.4% to 17.6%.
- The government's monthly rate held flat through 2025 at 3.2% to 3.4%, confirming a normalized labor market rather than a new surge.
What is a good employee turnover rate?
A good employee turnover rate is one at or below the median for your industry. There is no single national "good" number, because the healthy range depends entirely on your sector and roles. Two rules make any benchmark meaningful. Rule 1: Compare within your industry, not across it. A 20% rate is a warning sign in insurance, where 8.2% is normal, but a win in retail, where 26.7% is the industry average. Always measure against your own sector. Rule 2: Compare to the median, not the average. SHRM's 2021 data shows a median overall turnover rate of 15% against an average of 30%. A handful of very high-churn employers drag the average up, so the median describes a typical company far better.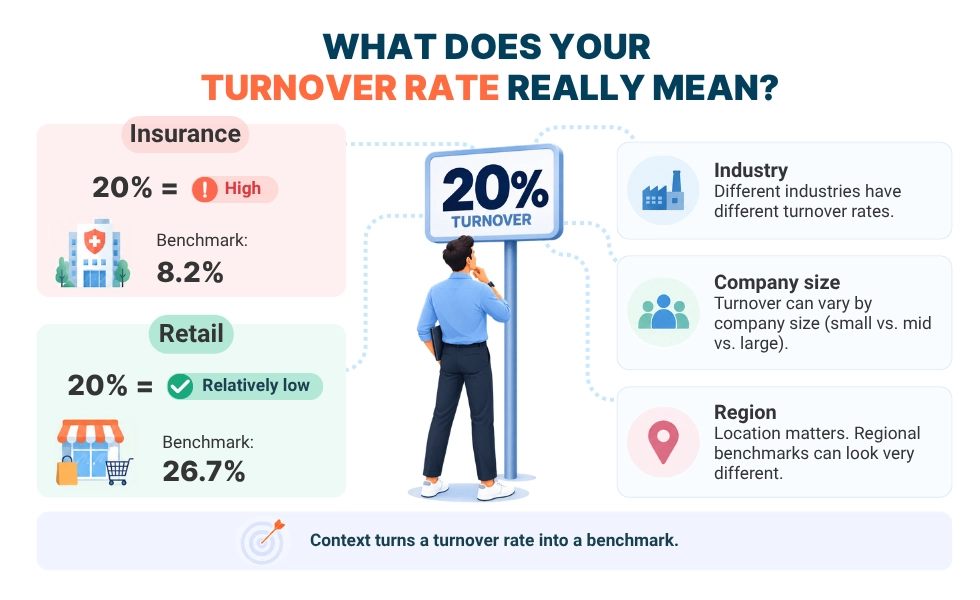
Why employees leave (and how much turnover is preventable)
Most voluntary turnover is preventable, and it usually breaks down long before the resignation. The pattern in the data is that managers miss the warning signs, not that pay is too low. All of the following come from Gallup. 30. According to Gallup, 42% of employees who voluntarily left say their manager or organization could have prevented it. Nearly half of quits were avoidable. 31. Besides, 51% of US employees are watching for or actively seeking a new job, meaning half the workforce is a potential departure. 32. Meanwhile, 77% of people who quit either left within three months of starting to look or did not actively search at all. The window to intervene is short. 33. According to the findings, 36% of voluntary leavers did not talk to anyone before deciding to resign. 34. The data further reveals that 44% of those who did discuss leaving never raised it with their direct manager.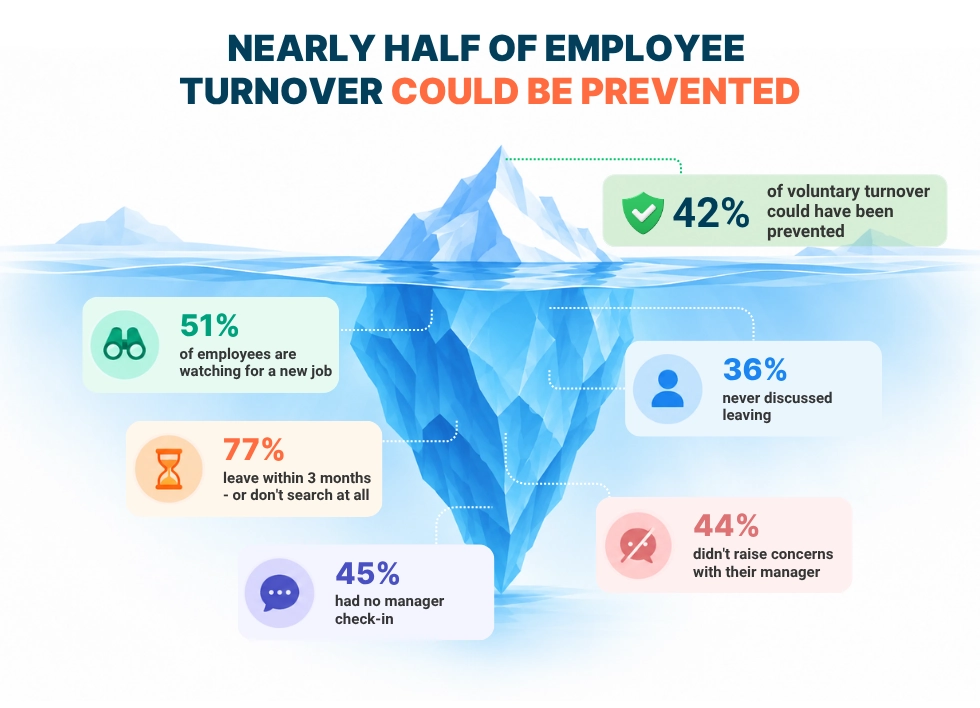
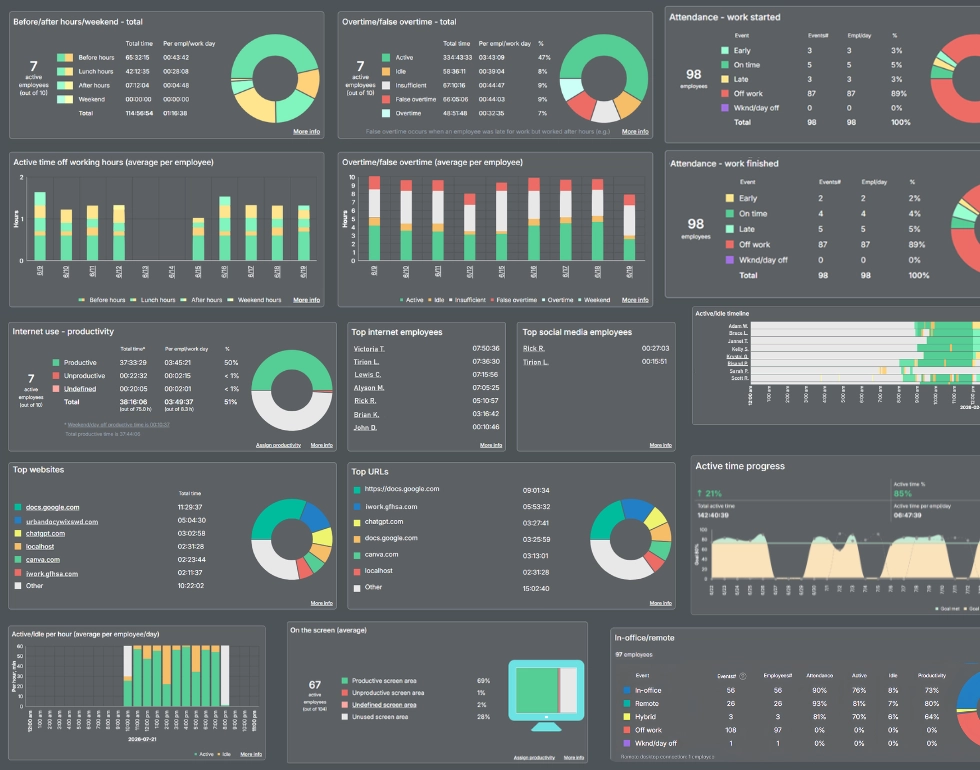

Stay ahead of employee turnover with 80+ WorkTime reports. Identify potential warning signs early and address them through transparent, privacy-conscious performance analytics.
Start free trialConclusion
The US employee turnover rate sits at 3.4% a month and 13.0% a year for voluntary departures as of mid-2026, and it has cooled steadily since the 2021 peak. But the national number is only a starting point. What matters is how your rate compares to the median for your specific industry, role mix, size, and region, and which way your trend is moving. The most important insight in the data is that nearly half of turnover is preventable, and it is preventable because the warning signs show up early. Seeing that risk before it lands is the difference between reacting to an exit interview and preventing one. That is what we built WorkTime to do.