


TL;DR
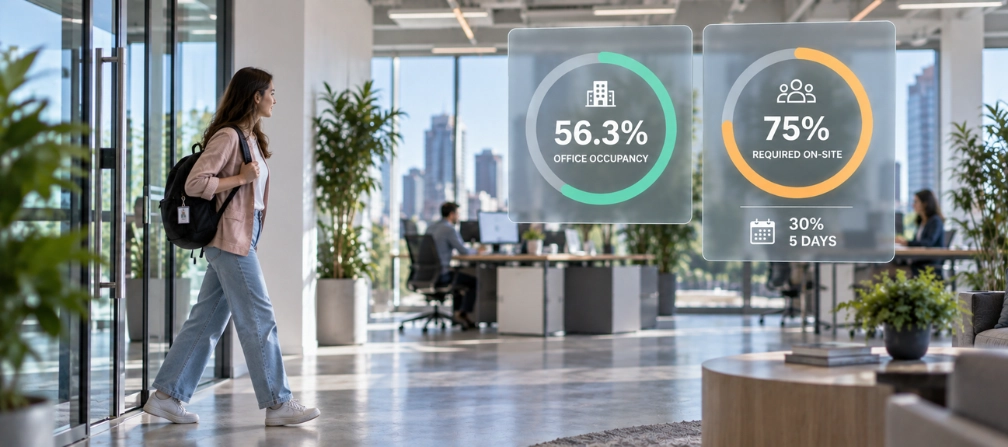
- Offices are the fullest they have been since 2020, but still far from full. Weekly occupancy peaked at 56.3%, a record recovery that still leaves buildings roughly 30% to 40% below pre-pandemic levels.
- Mandates won even though workers didn't. 75% of teleworkable employees who aren't fully remote are now required to be on-site, up from 63% in 2023, while 6 in 10 remote-capable workers still say they want hybrid.
- Strictness is still rising in 2026. 30% of companies now require a full five days on-site, up from 28% in 2025, and companies adding in-office days outnumber those cutting them by more than two to one.
- Mandates have a real attrition price. A peer-reviewed study of 54 S&P 500 firms found a 13% to 14% jump in turnover after return-to-office mandates, with women leaving about three times faster than men.
- Enforcement has gone digital. Only 19% of workers say their employer uses no tracking software at all, and 78% believe return-to-office is really about oversight.
In this article
The article is prepared by WorkTime, helping organizations gain a complete view of workforce performance through transparent analytics.
Office occupancy: how full are U.S. offices in 2026?
Office occupancy reached its highest level since early 2020, then plateaued well below pre-pandemic norms. The recovery is real but incomplete, and remote work has settled at a permanent share far above where it started. 1. According to Kastle Systems' Back to Work Barometer, 56.3% was the peak weekly average occupancy across all U.S. office buildings for the week of December 8, 2025, the highest weekly reading since early 2020. 2. What’s more, 66.0% was the single-day occupancy peak that same week, recorded on Tuesday, a new post-pandemic single-day record. 3. Significantly, 78.8% was the weekly occupancy in premium A+ class buildings, showing how much of the return concentrates in the best space (Kastle). 4. The findings show that 95.5% was the peak-day occupancy in A+ class buildings, nearly full on the busiest day. 5. Kastle measures actual badge swipes across 2,600+ buildings in 10 major metros, updated weekly, which makes it the most-cited occupancy benchmark in the country. 6. About 25% of all paid workdays in the U.S. were done from home in May 2026, according to Stanford's Survey of Working Arrangements and Attitudes, several times the pre-pandemic rate. 7. Employer plans for remote work hold steady at 1.3 to 1.5 days per week, a level that has barely moved since mid-2022 (Stanford WFH Research). 8. The Stanford survey has collected 200,000+ responses since May 2020, tracking the shift month by month.| Occupancy metric | Figure | Source |
|---|---|---|
|
Peak weekly office occupancy (wk of Dec 8, 2025) |
56.3% |
Kastle Systems |
|
Single-day occupancy record (Tuesday) |
66.0% |
Kastle Systems |
|
A+ class building weekly occupancy |
78.8% |
Kastle Systems |
|
Share of U.S. paid days worked from home (May 2026) |
~25% |
Stanford WFH Research |
WorkTime - transparent & effective monitoring!


The return-to-office split: hybrid, in-office, and remote
Hybrid is the stable norm for jobs that can be done remotely, but most of the total workforce was never remote in the first place. The two facts sit together, and mixing them up is why RTO numbers often look contradictory. 9. Among U.S. employees in remote-capable jobs, 52% work hybrid, 26% work exclusively remote, and 22% are fully on-site, per Gallup's hybrid work indicator. 10. According to Gallup, 6 in 10 employees with remote-capable jobs say they want a hybrid arrangement. 11. About one-third of remote-capable employees prefer fully remote work, and fewer than 10% prefer to be fully on-site. Only 11% of employees work under a team-set hybrid policy, the arrangement Gallup finds workers rate as fairest, so most hybrid rules are still imposed top-down. 12. Across all knowledge workers, including those without the option to work remotely, 63% are fully in-office, 28% are hybrid, and 9% are fully remote, according to the Owl Labs State of Hybrid Work report. 13. More than 30% of workers with teleworkable jobs now work from home all the time, down from 55% in October 2020 but still well up from 14% before the pandemic, per Pew Research Center. 14. The same research shows that 43% of teleworkable workers have a hybrid schedule, up from about a third in 2022. Given a free choice, 72% of hybrid workers would keep the hybrid setup and only 24% would go fully remote, so hybrid is a genuine preference, not just a compromise. 15. About 60% of U.S. workers hold jobs that cannot be done from home, which caps how large the remote share can ever get.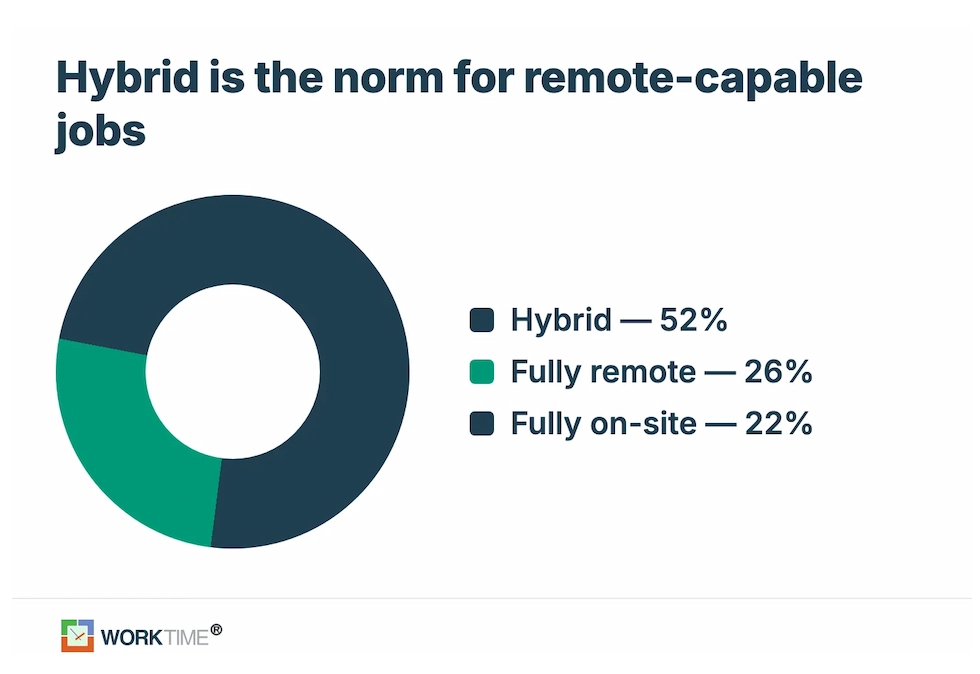
Return-to-office mandates are getting stricter
Required in-office days keep climbing, and the strictest five-day mandates are still spreading into 2026. Most of the tightening happens quietly, without a formal policy announcement. 16. According to Pew Research, 75% of teleworkable workers who are not fully remote say their employer requires in-office days, up from 63% in 2023. 17. In 2025, the two most common policies were a full five days on-site (28%) and three days a week (28%), with 13% of companies on a four-day rule, according to a ResumeBuilder survey of 978 business leaders. Separately, 11% let employees choose fully remote, and just 1% were fully remote. 18. For 2026, five-day requirements rise to 30%, four-day schedules climb to 17%, and three-day setups slip to 25%. 19. What’s more, 13% of companies plan to increase required in-office days in 2026, while only 5% plan to reduce them (ResumeBuilder). 20. Owl Labs reports that 39% of hybrid employees follow a three-day-a-week office schedule, the single most common model. 21. Besides, 34% of hybrid employees now go in four days a week, up from 32% in 2024 and 23% in 2023, a steady creep toward full-time. 22. Only 23% of employers made formal changes to their remote or hybrid policies in the past year, meaning most of the tightening is informal "hybrid creep" rather than announced mandates.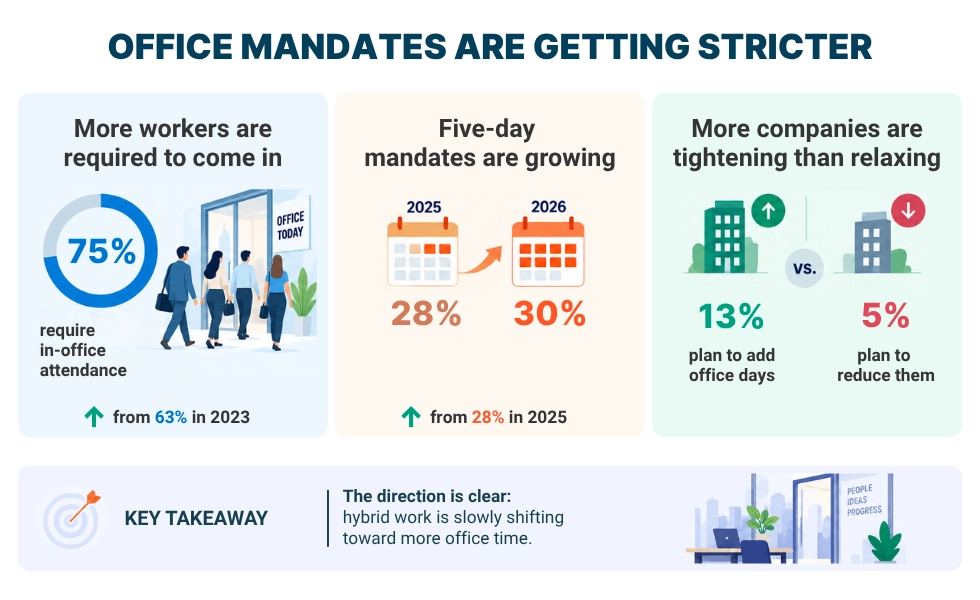
Return to office by industry, job function, and company size
Employer demand for on-site work surged in 2026, and flexibility now varies sharply by role. Marketing and senior positions keep the most flexibility, while frontline and healthcare roles keep the least. 23. Among new job postings analyzed in Q2 2026, 87% were fully on-site, 10% hybrid, and just 3% fully remote, per Robert Half. 24. Fully on-site job postings jumped from 65% in Q4 2025 to 87% in Q2 2026, a fast shift in what employers are willing to offer new hires. 25. Marketing and creative roles are the most flexible, with 14% of postings hybrid. 26. Technology postings run 11% hybrid and 4% remote, less flexible than marketing despite the sector's remote reputation. 27. Finance and accounting postings are 12% hybrid, and legal roles are 13% hybrid. 28. Administrative and customer support (5% hybrid) and healthcare (6% hybrid) offer the least flexibility, reflecting how much of that work is location-bound. 29. Seniority buys flexibility: 12% of senior-level postings are hybrid versus just 8% of entry-level postings. 30. The mandate wave has been led by tech and finance, the exact sectors studied in the 54-firm S&P 500 analysis of return-to-office effects (Baylor University). 31. About 90% of federal employees now work on-site full-time, making the federal government the strictest return-to-office cohort in the country, per Federal News Network's reporting on OPM guidance.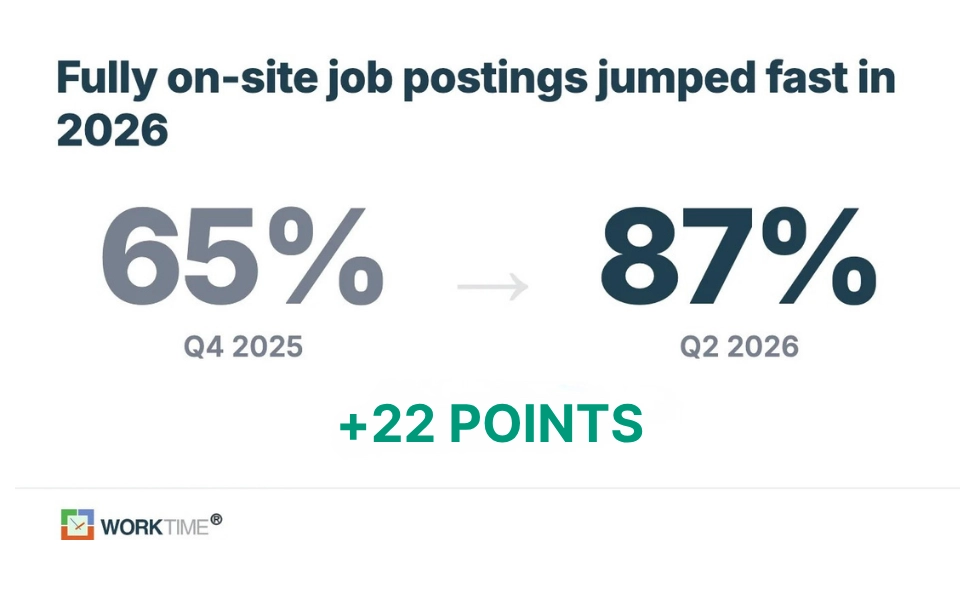
Return to office by metro area
Return-to-office intensity varies widely by city. Tech and government hubs post the highest occupancy and the strongest hybrid hiring demand. Here are the key findings from Robert Half research and Kastle’s latest findings. 32. Austin, TX, hit 92.9% occupancy on its peak day, a new city record. 33. Washington, DC, reached 64.3% on Tuesday, a post-pandemic high driven partly by the federal mandate. 34. New York averaged 59.5% weekly occupancy, above the national average. 35. The metros with the highest share of new hybrid job postings in Q2 2026 were Minneapolis, Boston, and San Francisco, each at 14%. 36. Denver, Seattle, Austin, and Chicago each hit 13% hybrid postings, with New York, Atlanta, and Washington, DC, at 12%. 37. By state, Minnesota and Massachusetts led hybrid postings at 13%, followed by New York at 12%.| Metro | Peak occupancy (Kastle) |
Hybrid job postings, Q2 2026 (Robert Half) |
|---|---|---|
|
Austin, TX |
92.9% |
13% |
|
Washington, DC |
64.3% |
12% |
|
New York, NY |
59.5% |
12% |
|
San Francisco, CA |
Not reported |
14% |
|
Boston, MA |
Not reported |
14% |
|
Minneapolis, MN |
Not reported |
14% |
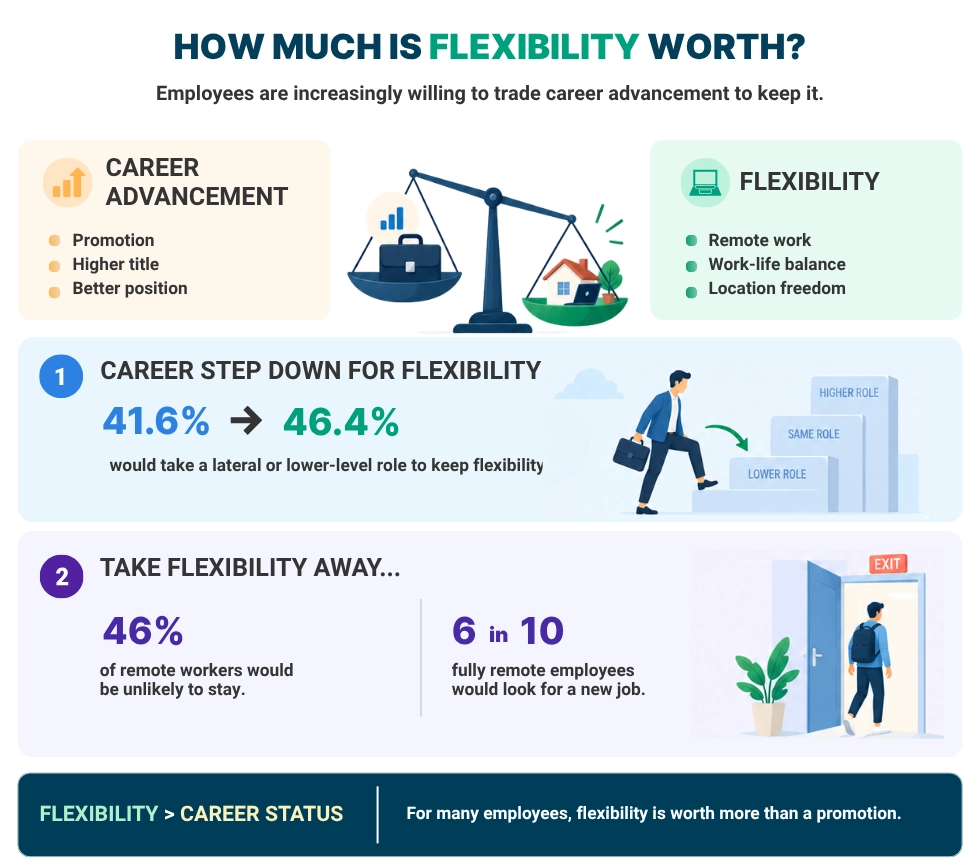
Return to office by generation
Younger workers want flexibility most and are driving new work patterns, even as almost everyone stays put in a shaky job market. The generational split shows up clearly in demand for splitting the workday. Here are the key findings from the report by Owl Labs. 38. Interest in "microshifting," breaking the workday into non-traditional blocks, runs to 65% among office workers overall, rising to 69% for Gen Z and 73% for millennials. 39. On ideal schedules, 25% of workers want to be in the office full time, 21% want four days, and 21% want three days, a near-even split with no clear majority. 40. Significantly, 92% of workers have not changed jobs in the past year, a "job hugging" pattern that keeps people in place even when they dislike a mandate.Return-to-office mandates and employee attrition
Return-to-office mandates measurably raise turnover, and the losses concentrate among women and senior talent. This is the clearest evidence that strict mandates carry a hidden cost. 41. A study of 54 large tech and financial firms in the S&P 500 found an average 13% to 14% increase in abnormal turnover after they announced return-to-office mandates, per researchers at Baylor University and the University of Pittsburgh. 42. The analysis covered more than 3 million individual worker profiles. 43. Women left at roughly three times the rate of men after mandates took effect. 44. Senior managers and high-skilled employees showed the largest jump in attrition, the hardest workers to replace. 45. Job-vacancy duration rose from 51 to 63 days on average, as mandating firms struggled to backfill open roles.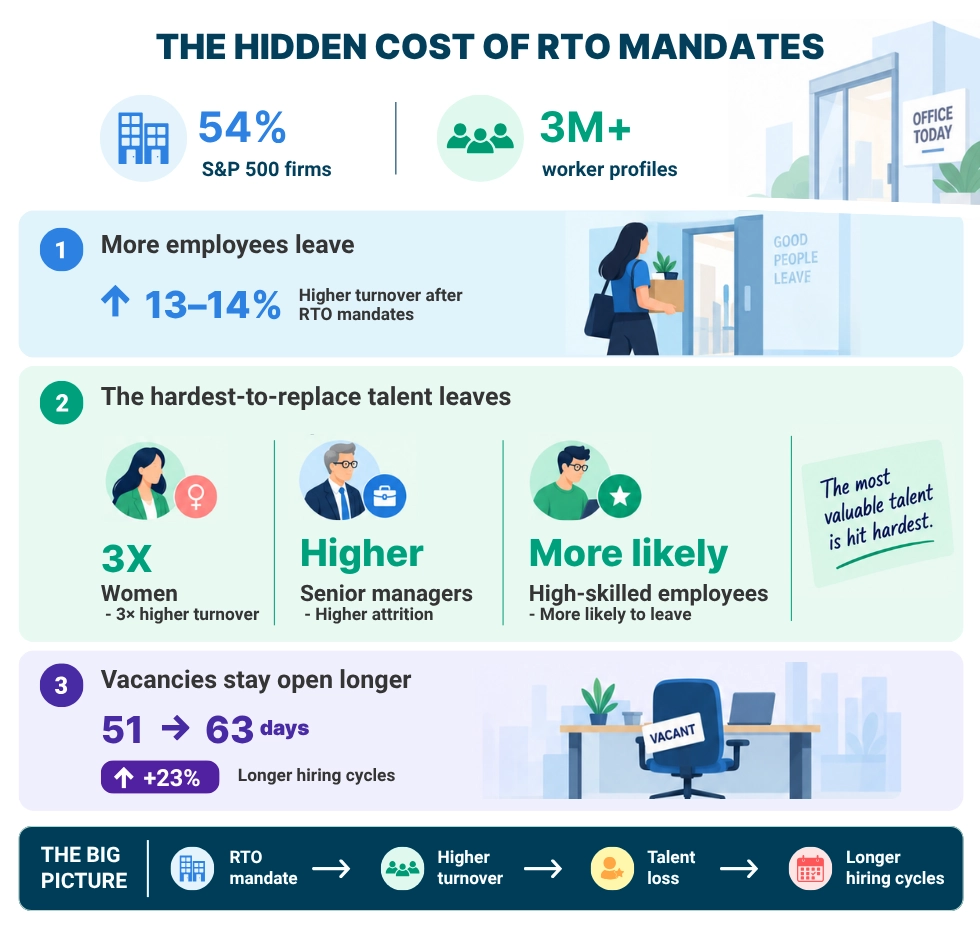
Why companies are pushing return to office
Employers point to culture and productivity, but a notable minority admit the quiet part: mandates are a way to shrink headcount without layoffs. The stated reasons and the real reasons do not always match. Explore more statistics from the Resume Builder survey. 51. Among companies adding in-office days, the top reasons are strengthening culture (64%), improving productivity (62%), and maximizing office space (45%). 52. According to the survey, 8% of companies increasing in-office days admit they are doing it to push employees to quit, confirming the "quiet layoff" workers suspect. 53. Among companies cutting in-office days, the reasons are employee happiness (55%), well-being (53%), and retention (49%). 54. Only 28% of companies offer any incentive to return, and among those the perks are social events (55%), catered meals (51%), and commuter benefits (51%). 55. Notably, 38% of companies adding in-office days plan to expand their office space in 2026, a real estate bet on the mandate holding.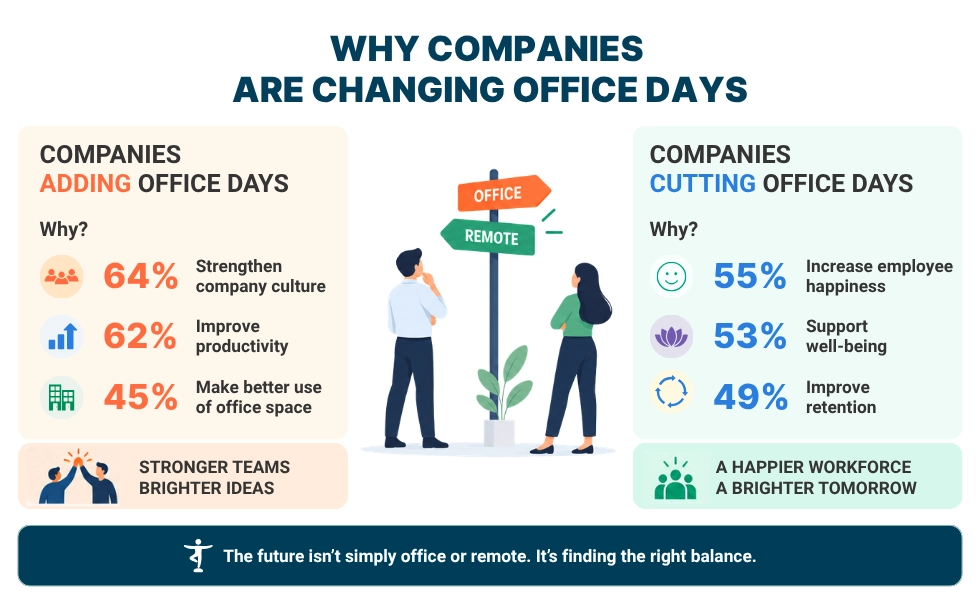
Compliance and monitoring: how companies enforce return to office
Return-to-office enforcement has gone digital, and workers know it. The result is a trust problem that badge counts alone cannot solve. 56. Only 19% of workers say their company uses no employee tracking software, and another 14% are unsure, meaning most workplaces now run some form of monitoring (Owl Labs). 57. Based on Owl Labs’ findings, 78% of workers believe their company enforces return-to-office policies mainly to maintain oversight, not collaboration. 58. What’s more, 47% of workers cite monitoring as a top workplace concern. 59. Significantly, 85% of workers say employers should be legally required to disclose when they use tracking tools.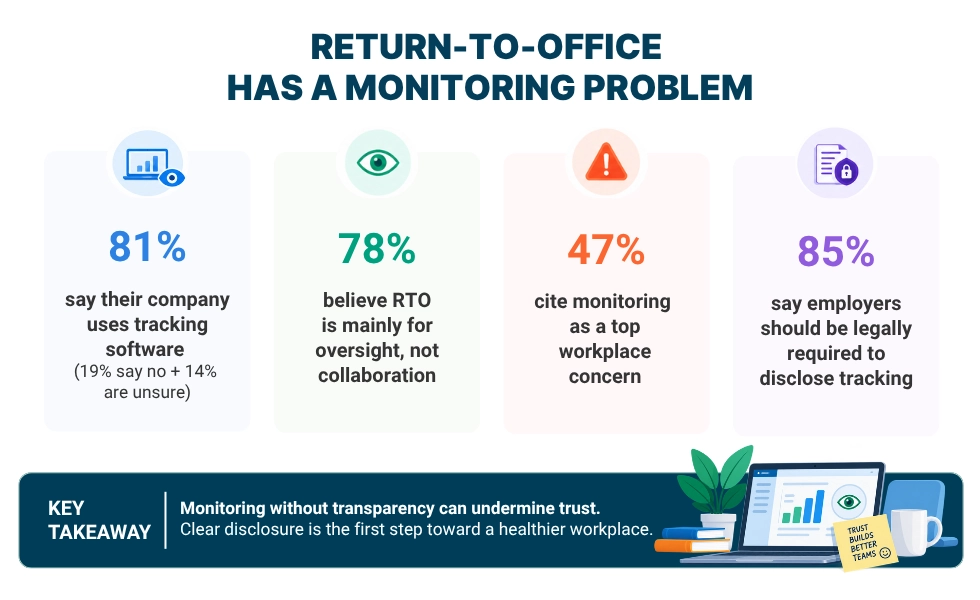
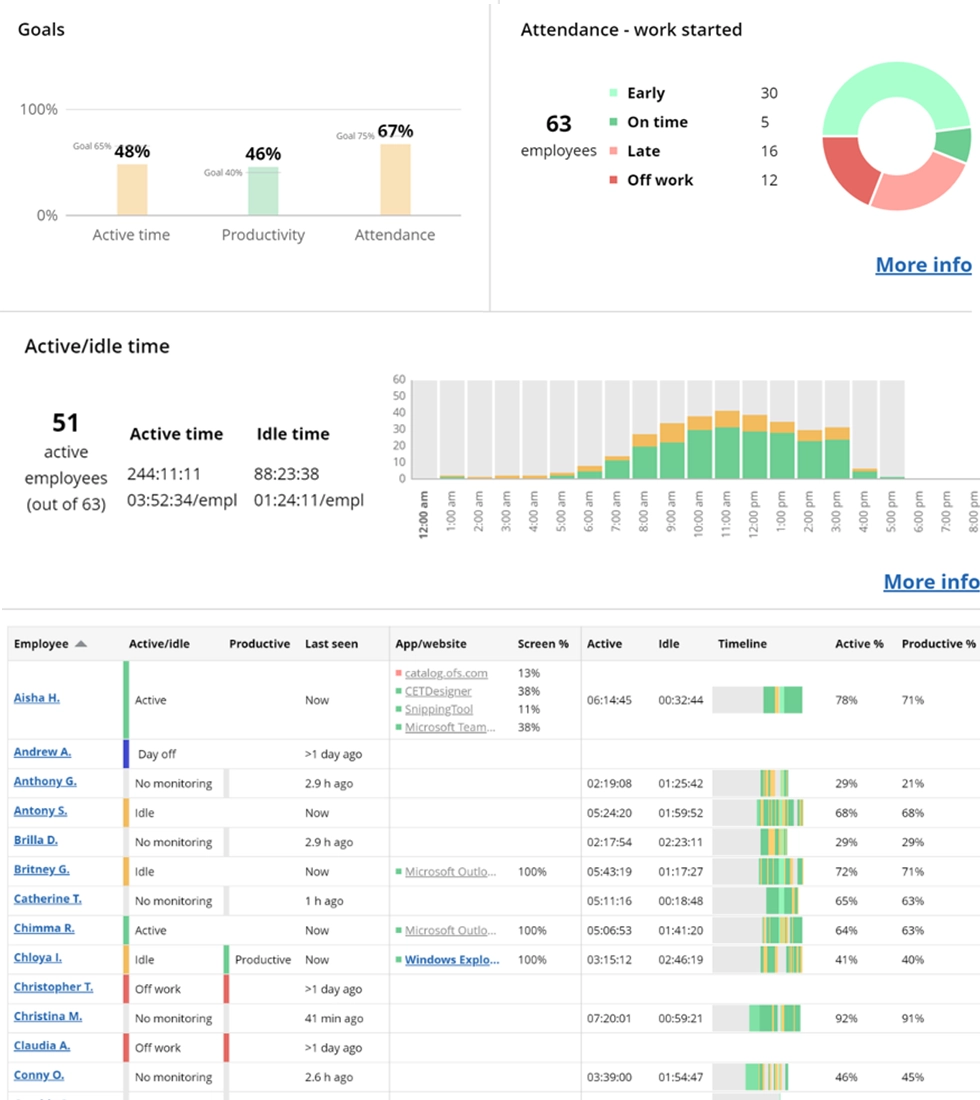

Get a clear, transparent picture of your team’s workday in real time. Track current status, work location, arrival and active time, apps and websites in use, goals, and days off.
Start free trialRemote vs. in-office engagement and productivity
Office-bound workers report more disengagement than remote ones, and flexibility carries real financial value to employees. Engagement is falling worldwide, which raises the stakes on getting the return-to-office balance right. 60. According to Owl Labs, 46% of full-time office workers report feeling disengaged, compared with 30% of remote employees. 61. The average commute costs workers 62 minutes a day, time that shapes how they feel about a mandate. 62. Workers say they would trade 9% of their salary for flexible hours and 8% for a four-day week. 63. Notably, 47% of workers say they do not have the overall flexibility they want. 64. Global employee engagement fell for a second straight year in 2025 to its lowest level since 2020, and low engagement cost the world economy an estimated $10 trillion in lost productivity, per Gallup's State of the Global Workplace. For the full picture on output at home versus the office, see our remote work productivity statistics.Monitor in-office, remote, & hybrid - non-invasively!
The bottom line
Return to office won on paper in 2026. Occupancy is at a post-pandemic high, mandates cover three-quarters of teleworkable workers, and employers are demanding on-site presence from new hires at rates not seen since before COVID. But the workforce is answering back. Most remote-capable workers still want hybrid, engagement is falling, and at the strictest firms, the best people, especially women and senior talent, are leaving faster than they can be replaced. The lesson in the data is that presence is not the same as productivity, and surveillance is not the same as trust. The companies that handle this well measure outcomes, not chairs. With more than 26 years of experience in employee monitoring, WorkTime now supports 9,500+ organizations with a non-invasive approach to workforce analytics. Our productivity analytics compare remote and in-office output side by side and flag burnout early, without screenshots or keystroke logging, which turns the return-to-office decision into a data question instead of a guessing game. You can try WorkTime free for 14 days to see the difference.Try WorkTime now!