


TL;DR
- Coffee badging is declining in raw prevalence, not rising. Among hybrid workers, it fell from 58% (2023) to 44% (2024) to 43% (2025) in Owl Labs surveys, even though headlines call it a comeback.
- Managers coffee badge more than their own staff. 47% of managers admit to it versus 34% of individual contributors. Enforcement is weak partly because the enforcers do it too.
- Companies are cracking down. 3 in 4 companies report return-to-office non-compliance, 52% planned stricter enforcement, and roughly 81% of workers now say their employer uses tracking software.
- The office is half-empty on the edges of the week. Badge-swipe occupancy peaks near 66% on Tuesdays and drops to about half that on Fridays, which is exactly why a brief mid-week appearance reads as presence.
- Presence is not productivity. A badge swipe proves someone entered the building, not that they worked. 42% of employees feel more pressure to look present than to be productive.
In this article
Brought to you by WorkTime, a non-invasive employee monitoring platform that combines transparent workforce analytics with compliance-ready features for modern organizations.
Coffee badging prevalence: The 3-year trend
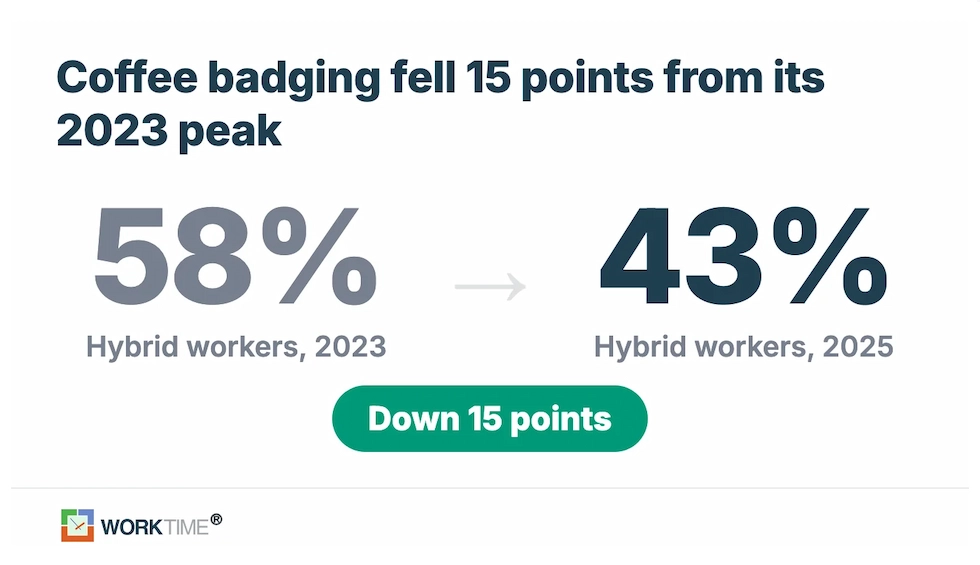
Coffee badging peaked in 2023 and has declined each year since. The figure most often quoted online, 58%, is a 2023 number. The current rate among US hybrid workers is 43%. All three Owl Labs figures below measure US hybrid workers, so the year-over-year decline is a like-for-like comparison.| Year | Hybrid workers who admit to coffee badging |
Source |
|---|---|---|
|
2023 |
58% |
Owl Labs |
|
2024 |
44% |
Owl Labs |
|
2025 |
43% |
Owl Labs |
Coffee badging by generation
Younger cohorts drive flexible-work behavior, but perception and measured behavior split. Millennials show the highest measured coffee-badging rates, while workers believe Gen Z is the most guilty. 9. Millennials are the most likely to coffee badge, followed by Gen X, Gen Z, then Baby Boomers. Exact per-generation percentages were not confirmable against an original source and are excluded here. 10. Significantly, 46% of workers believe Gen Z is the generation most guilty of coffee badging. Worker perception points to Gen Z, more than Millennials, Gen X, or Boomers, per Monster. That perception conflicts with the measured data, which puts Millennials highest. 11. Gen Z workers are the most likely to hold an additional job: 38%, versus 31% of Millennials, 20% of Gen X, and 13% of Boomers (2025). This side-job split shows younger cohorts leading flexible and boundary-pushing work behaviors generally.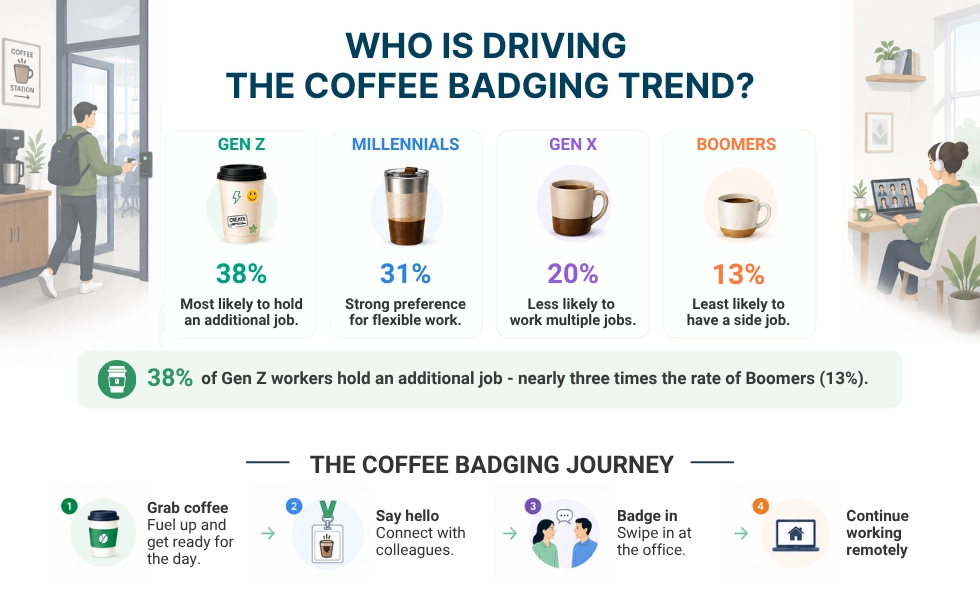
Managers vs. individual contributors
Managers coffee badge more than the people they manage. This is the single clearest reason return-to-office mandates go unenforced. 12. Regarding Owl Labs' hybrid work survey, 47% of managers admit to coffee badging, versus 34% of individual contributors. Managers outpace their staff by 13 points. 13. In France, 32% of managers coffee badge compared to 11% of individual contributors. Managers there do it at nearly three times the rate of their reports, per Owl Labs' analysis of coffee badging.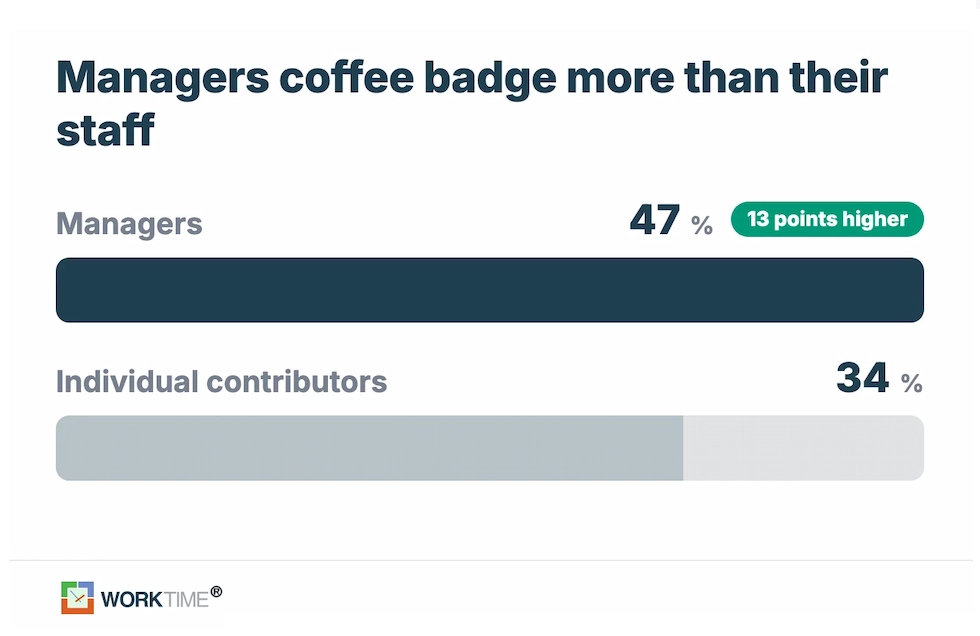
Why employees coffee badge
Coffee badging is mostly a response to return-to-office mandates that workers see as visibility theater. The reasons are about career optics, flexibility, and commute logistics, not laziness. 15. According to Monster, 21% of coffee badgers do it to balance remote work with in-office visibility for career growth. Being seen matters for advancement, so workers show their face and then leave. 16. Significantly, 21% of coffee badging incidents reflect employees’ desire for greater remote work flexibility. The brief office visit often signals dissatisfaction with return-to-office policies. 17. The same research found that 17% coffee badge because they enjoy the office social atmosphere. For some workers, the draw is connection, not the full workday. 18. About 14% coffee badge to avoid long commutes by traveling off-peak. Showing up briefly at odd hours beats a rush-hour round trip. 19. Notably, 46% of workers believe coffee badging can increase productivity, while 43% think it decreases it. Opinion is nearly split, with 24% crediting flexible routines and 36% blaming wasted commute time. 20. According to Forbes, 42% of employees feel more pressure to be visibly present in the office than to be productive. The pressure to be seen outweighs the pressure to perform. This is the core tension coffee badging exposes.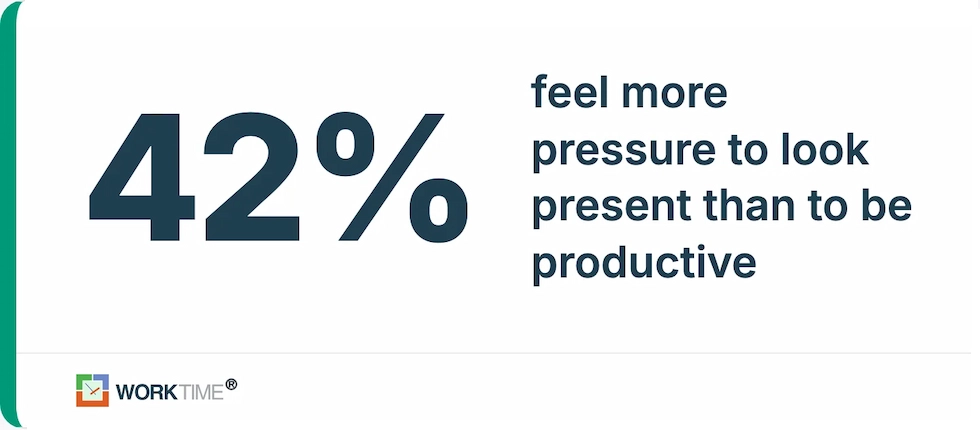
Return-to-office mandates and non-compliance
Most companies with return-to-office policies struggle to enforce them, and workers are pushing back. Coffee badging is one tactic inside a broader non-compliance problem. 22. According to ResumeTemplates' survey of 713 business leaders, 3 in 4 companies (75%) report issues with workers not complying with return-to-office policy. Non-compliance is the norm, not the exception. 23. Non-compliance tactics: 47% of workers simply do not show up, 40% do not stay the full day, and 7% manipulate tracking systems. The 40% who leave early are the coffee badgers, per ResumeTemplates. 24. The same survey reports that 52% of companies planned stricter enforcement, with 22% definitely and 30% probably tightening rules. More than half moved toward a crackdown. 25. Notably, 60% of companies currently track office attendance, and 70% planned to track it going forward. Attendance monitoring is becoming standard. 26. Attendance tracking methods: 60% use badge swipes, 27% use computer-login software, and 23% use time-clock or punch-in systems. Badge swipes lead, which is precisely the signal for coffee badging games, per ResumeTemplates.| Attendance tracking method | Share of companies |
|---|---|
|
Badge swipes |
60% |
|
Computer-login software |
27% |
|
Time clock/punch-in |
23% |
Getting caught: Enforcement and consequences
Most coffee badgers get caught, but employers often do not mind. When they do, consequences can escalate to termination. 32. According to an Owl Lab survey, 70% of workers who attempted coffee badging in 2024 were caught by their employer. Being noticed is the rule, not the exception. 33. The data also reveals that 59% of caught coffee badgers said their employer did not mind (2024). Getting spotted rarely triggered a reaction that year. 34. In 2025, 56% of coffee badgers had been caught, but their employer did not mind; 13% were caught, and their employer was unhappy; and 31% had not been caught. Most who are seen face no consequence, but a growing share meets pushback.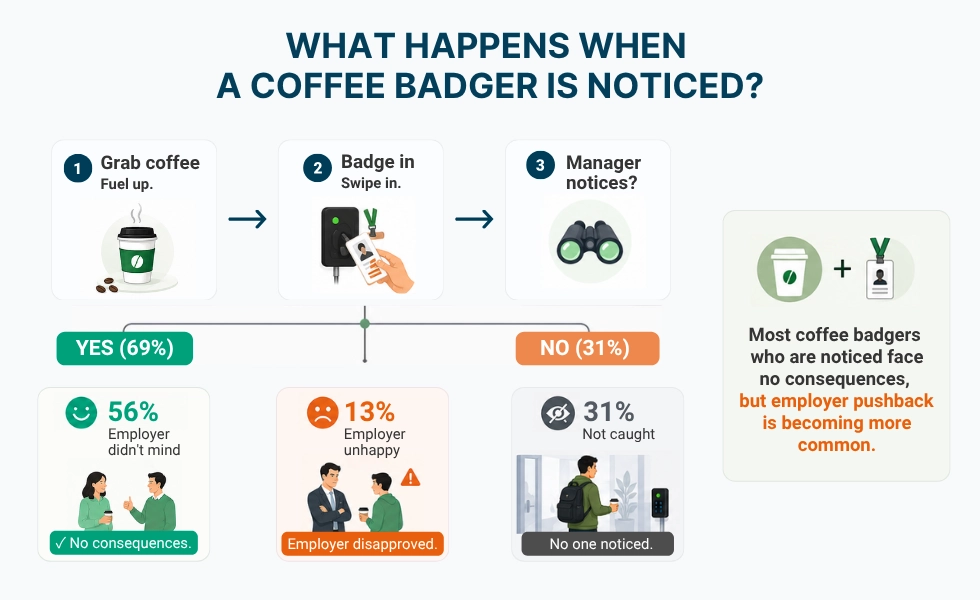
How companies are responding: tracking and monitoring
Employers are answering coffee badging with more tracking, but badge and login data measure presence, not work. That gap is the whole point of coffee badging. 36. Roughly 81% of workers say their company uses employee-tracking software (2025). Only 19% said their employer was not using it, per Owl Labs' State of Hybrid Work report. 37. According to Owl Labs' hybrid work survey, 86% of employees believe companies should be legally required to disclose when they track staff (2024). 38. Significantly, 47% of workers cite having their work activities monitored as a top source of stress (2025). Monitoring itself is a stressor, which is why heavier-handed invasive tracking often backfires. A badge swipe or a login timestamp confirms that someone arrived, not that they did any work. That is the exact gap coffee badging exploits. The alternative to more invasive tracking is attendance verification tied to real output, measured without screenshots or keystroke content logging, so presence stops being the metric that matters. WorkTime is built to compare remote and in-office productivity on the work itself, not the door swipe.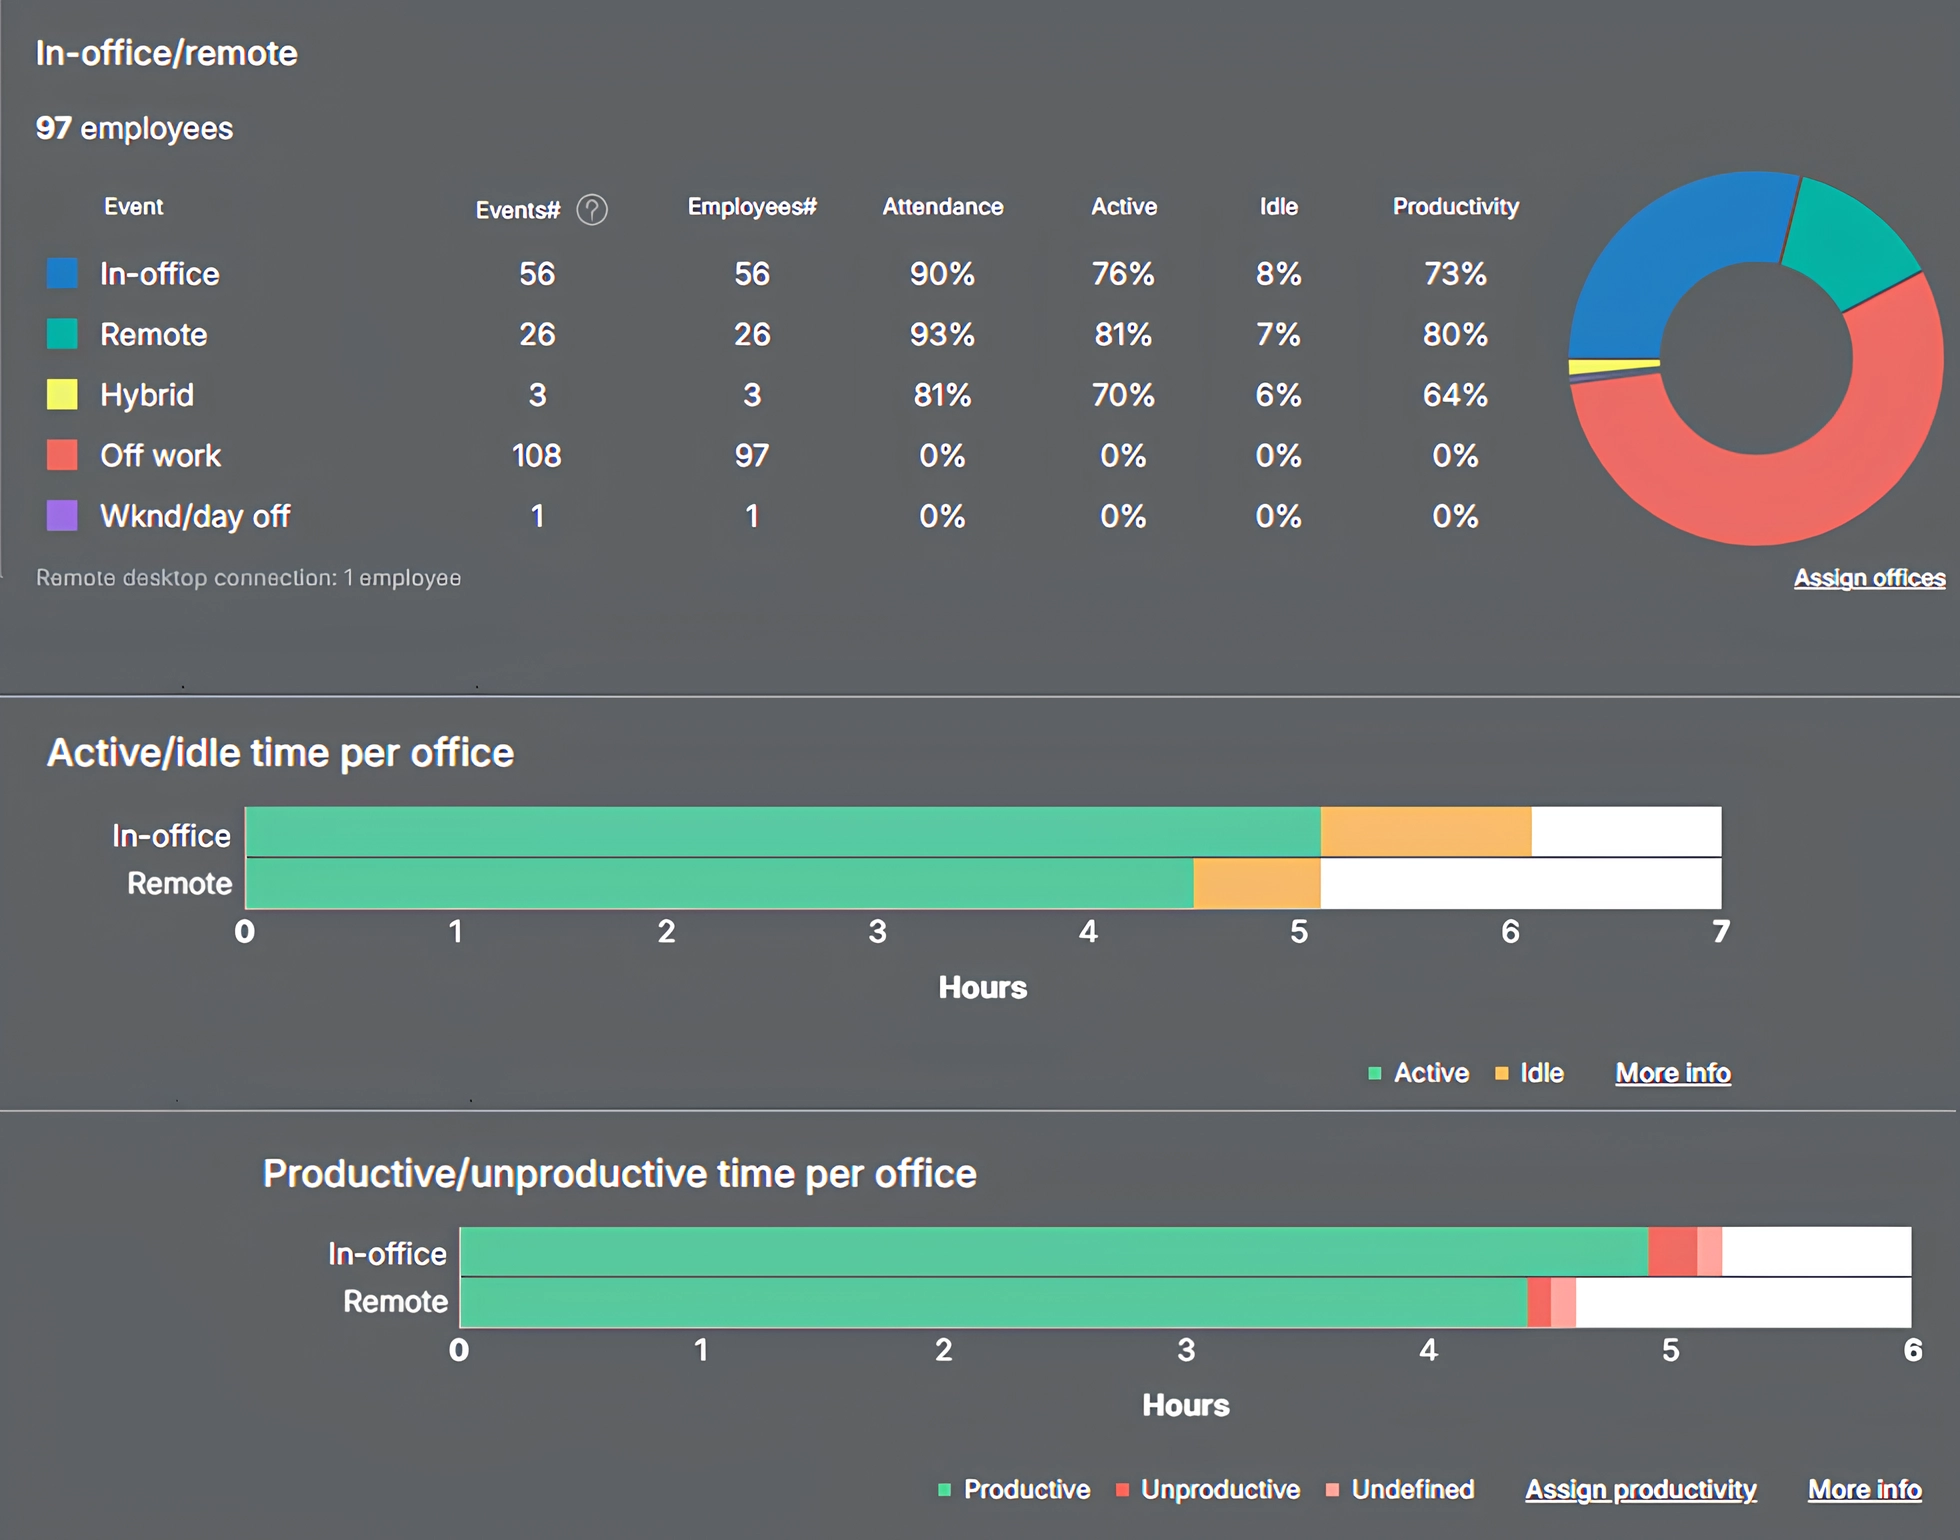


Compare attendance, productivity scores, and application usage to uncover location-based performance trends.
Start free trialThe office occupancy reality
Coffee badging works because offices are busy in the middle of the week and near-empty on the edges. Badge-swipe data shows the pattern clearly. 39. The Kastle 10-City Back to Work Barometer averaged 56.3% office occupancy for the week of December 8, 2025, its highest level since 2020. Physical badge data confirms attendance is rising. 40. Tuesday is the peak office day: all tracked buildings hit 66.0% occupancy, a post-pandemic single-day record, while A+ rated buildings reached 95.5%. Mid-week is when the office fills, according to Kastle. 41. City peaks vary widely: Washington, DC hit 64.3% on Tuesday, Austin reached 92.9% on Wednesday, and New York averaged 59.5% for the week. Occupancy is concentrated Tuesday through Thursday, with Monday and Friday running near half the mid-week peak. That trough is what makes a brief mid-week appearance read as compliance. Compare it against our remote work statistics.| Location | Occupancy | When |
|---|---|---|
|
10-city average |
56.3% |
Week of Dec 8, 2025 |
|
All buildings, peak day |
66.0% |
Tuesday |
|
A+ rated buildings |
95.5% |
Tuesday |
|
Washington DC |
64.3% |
Tuesday |
|
Austin |
92.9% |
Wednesday |
|
New York |
59.5% |
Weekly average |
What it costs to go into the office
Going into the office is expensive, which is a direct driver of coffee badging. The widely repeated "$51 a day" figure is wrong. The verified 2025 number is $55. 42. In-office and hybrid workers spend an average of $55 a day to work from the office in 2025, down from $61 in 2024. This corrects the "$51 per day" figure circulating in AI summaries, per Owl Labs' State of Hybrid Work report. 43. That $55 daily cost includes about $15 on commuting and $18 on lunch, while remote workers spend an average of $18 a day at home. Working on-site costs roughly three times as much as working remotely, according to Owl Labs.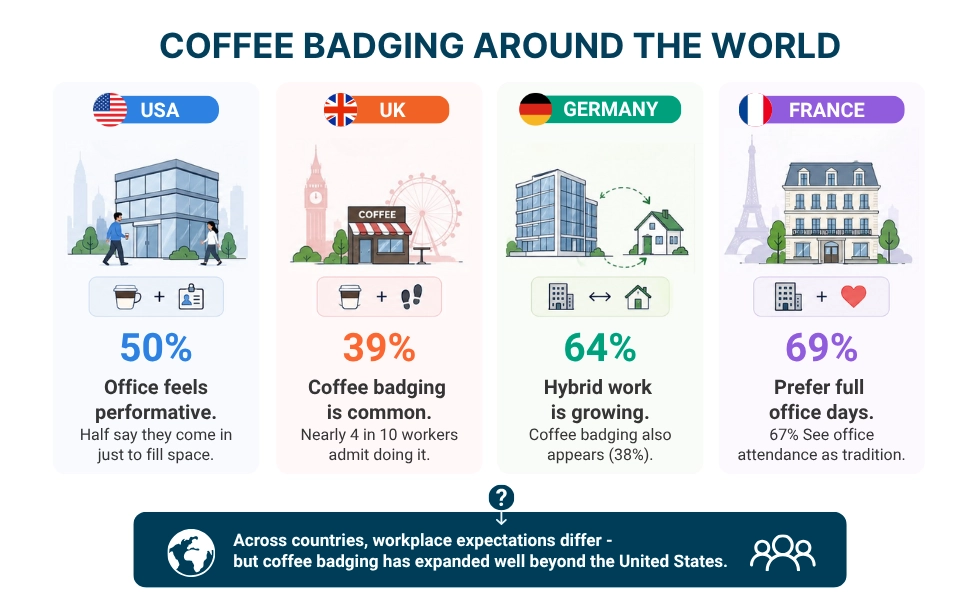
Coffee badging around the world
Coffee badging is not only a US phenomenon, though the US leads. Attitudes toward office presence differ sharply by country. 46. According to the Owl Labs survey, 39% of workers in the UK and 38% in Germany admitted to coffee badging in 2023. The practice tracked the US pattern abroad, though at lower rates. 47. Moreover, 64% of German employees work in a hybrid format, up from 51%. Hybrid adoption in Germany rose sharply. 48. The data also reveals that 50% of US employees feel they only come into the office to fill space, versus 31% in Germany. US workers are far more likely to see office time as performative. 49. In France, 69% of workers prefer the full office workday, and 67% believe they only go in due to tradition. Attitudes are contradictory: workers accept the full day while doubting its purpose, per Owl Labs.Workforce and stress context
Workplace stress is high, and many workers are already looking to leave. Coffee badging is one response to these workplace pressures. 50. Stress is near-universal, according to Owl Labs' State of Hybrid Work report. 90% of employees say they are stressed at work, and 39% say it has gotten worse than the prior year (2025). 51. What’s more, 27% of workers are actively looking for a new job (2025). More than a quarter are already job-searching. 52. Per Owl Labs, 73% of workers say their company did not change its remote or hybrid policy in the past year (2025). Most mandates held steady rather than tightening or loosening.The bottom line
Coffee badging is a measurable, declining, but persistent signal that presence-based return-to-office rules miss the point. Hybrid workers admit to it at 43% in 2025, down from 58% in 2023, and most who get caught face no consequence. The behavior exists because a badge swipe rewards being seen, not getting work done, and 42% of employees feel exactly that pressure. The fix is not heavier-handed invasive tracking, which 47% of workers already name as a top stressor. It is measuring the work itself. At WorkTime, we have spent more than 26 years building non-invasive employee monitoring software that verifies attendance and compares remote versus in-office productivity without screenshots, keystroke content logging, or screen recording, trusted by more than 9,500 organizations. That shifts the metric from who showed up to who actually got work done. To see how presence and productivity compare on your own team, start a free 14-day trial.Try WorkTime now!