Employee engagement is at a 10-year low. Only 31% of U.S. employees and 20% of workers worldwide are engaged at work, and disengagement now costs the global economy roughly $10 trillion a year. The numbers below are pulled from primary research, led by Gallup, and dated so you can cite them with confidence.
This is the engagement-specific data set: how many workers are engaged, what it costs, what moves the needle, and how engagement breaks down by manager, work arrangement, generation, and industry.
The article is prepared by WorkTime, delivering transparent performance insights that help organizations build more engaged and motivated teams.
The state of employee engagement in 2026
U.S. employee engagement has fallen to its lowest point in a decade, and the global picture is weaker still. Engagement measures how involved and committed employees are to their work and workplace, not how satisfied or happy they are.
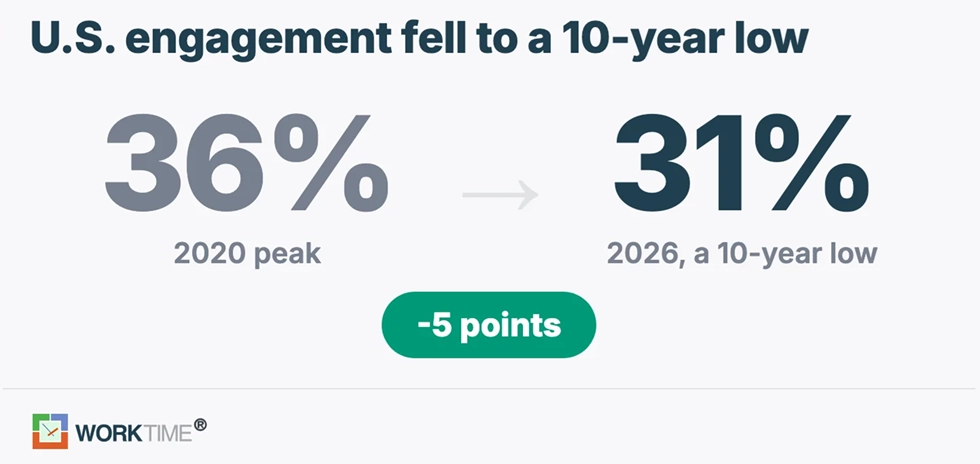
1. According to Gallup, 31% of U.S. employees are engaged at work, a 10-year low that matches the 2014 rate.
2. Due to Gallup's State of the Global Workplace report, 20% of employees worldwide are engaged, the lowest global figure since 2020.
3. Data shows that 17% of U.S. employees are actively disengaged, meaning they are disconnected enough to potentially act against the organization's interests (Gallup).
4. The majority of workers are "not engaged", the passive middle that does the minimum and is open to leaving (Gallup).
5. U.S. engagement dropped 2 percentage points since 2023 and 5 points since its 2020 peak of 36% (Gallup).
6. The decline represents roughly 8 million fewer engaged U.S. workers than in 2020 and about 3.2 million fewer than in 2023 (Gallup).
7. Global engagement peaked at 23% in 2022 before falling to 20% in the most recent reading (Gallup).
8. Best-practice organizations reach 70% engagement, showing the ceiling is far higher than the average (Gallup).
For a closer look at how engagement connects to day-to-day output, see our employee productivity statistics and employee monitoring statistics.
The cost of employee disengagement
Disengagement is the single largest hidden cost most organizations carry. It shows up as lost output, higher turnover, and more absences rather than a line item, which is why it goes unmanaged.
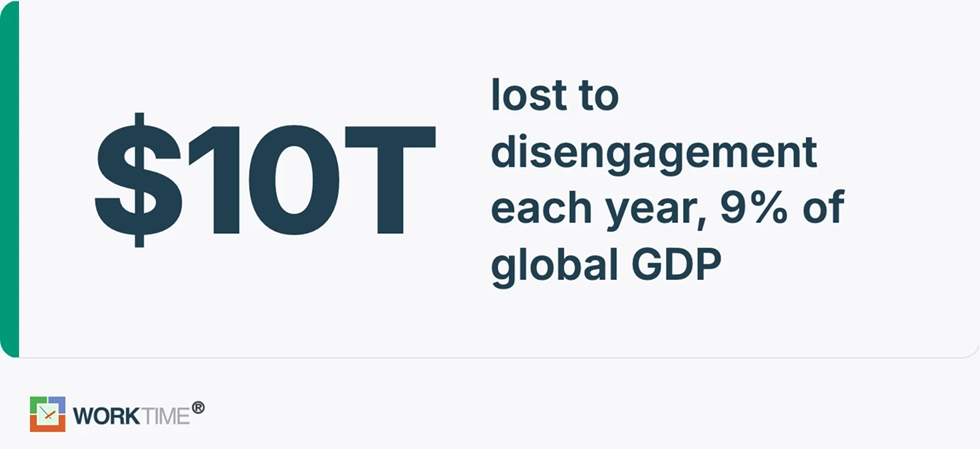
9. Low engagement costs the global economy about $10 trillion, or 9% of global GDP, per Gallup's State of the Global Workplace.
10. Roughly 6 in 10 employees worldwide are "not engaged", present but giving minimal discretionary effort, which is where most of that lost output comes from (Gallup).
11. More than half of employees worldwide are watching for or actively seeking a new job, a direct downstream cost of weak engagement (Gallup).
12. Disengagement hits hardest where it lingers: the 17% of U.S. employees who are actively disengaged tend to erode the work of engaged colleagues (Gallup).
13. Burnout, a common driver of disengagement, can cost organizations a meaningful share of payroll in voluntary turnover. We break the burnout data down separately in our employee burnout statistics.
Business outcomes of high employee engagement
Engagement is not a soft metric. Gallup's Q12 meta-analysis, one of the largest workplace studies ever run, links engagement directly to profit, productivity, retention, and safety.
The 11th-edition meta-analysis covered 183,806 business units across 53 industries and 90 countries, comparing top-quartile and bottom-quartile teams.
14. Highly engaged business units are 23% more profitable than the least engaged (Gallup).
15. Engaged teams record 18% higher productivity measured by sales (Gallup).
16. Engagement correlates with 78% lower absenteeism between top and bottom quartile teams (Gallup).
17. Engaged teams see 21% lower turnover in high-turnover organizations and 51% lower turnover in low-turnover organizations (Gallup).
18. High engagement is tied to 63% fewer safety incidents (Gallup).
19. Engaged teams produce 32% fewer quality defects (Gallup).
The full top-versus-bottom-quartile comparison from the Q12 meta-analysis:
Business outcome
Difference (top vs. bottom quartile)
Profitability
23% higher
Productivity (sales)
18% higher
Productivity (production records)
14% higher
Customer loyalty/engagement
10% higher
Organizational citizenship
22% higher
Employee well-being
70% higher
Turnover (high-turnover orgs)
21% lower
Turnover (low-turnover orgs)
51% lower
Absenteeism
78% lower
Shrinkage (theft)
28% lower
Safety incidents
63% fewer
Patient safety incidents
58% fewer
Quality (defects)
32% fewer
20. Engaged teams report 70% higher well-being than disengaged teams (Gallup).
21. The correlation between engagement and overall performance is 0.49, with top-half business units holding 2.33 times higher odds of success (Gallup).
22. Engaged teams show 10% higher customer loyalty and engagement (Gallup).
What drives employee engagement
Three levers move engagement more than any perk: clear expectations, recognition, and development. All three have weakened in the U.S. since 2020, which tracks with the engagement decline.
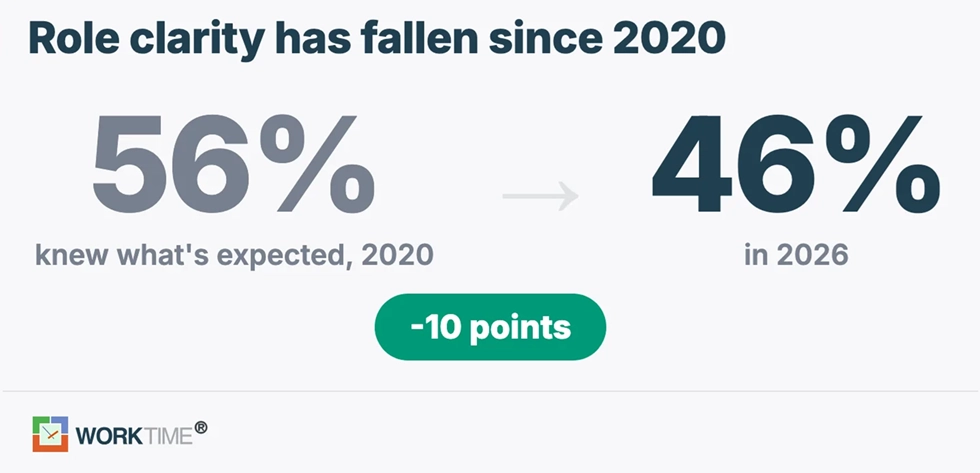
23. Only 46% of U.S. employees clearly know what is expected of them at work, down from a high of 56% in 2020 (Gallup).
24. Clarity of expectations is one of the strongest predictors of engagement Gallup measures, and it has fallen further than almost any other element since 2020 (Gallup).
25. Just 39% of employees feel someone at work cares about them as a person, down from 47% in 2020 (Gallup).
26. Only 30% of employees strongly agree that someone at work encourages their development, down from 36% in 2020 (Gallup).
27. According to the data, 84% of employees say learning adds purpose to their work, and providing learning opportunities is the top retention strategy organizations report using, per LinkedIn's Workplace Learning Report.
28. Only about 1 in 3 U.S. workers strongly agree they received recognition for good work in the past seven days, leaving most employees unrecognized (Gallup).
29. Employees who do not feel adequately recognized are twice as likely to say they will quit within the next year (Gallup).
30. The organizations that improve engagement the most treat it as a daily management practice, holding managers accountable for acting on results rather than just running an annual survey (Gallup).
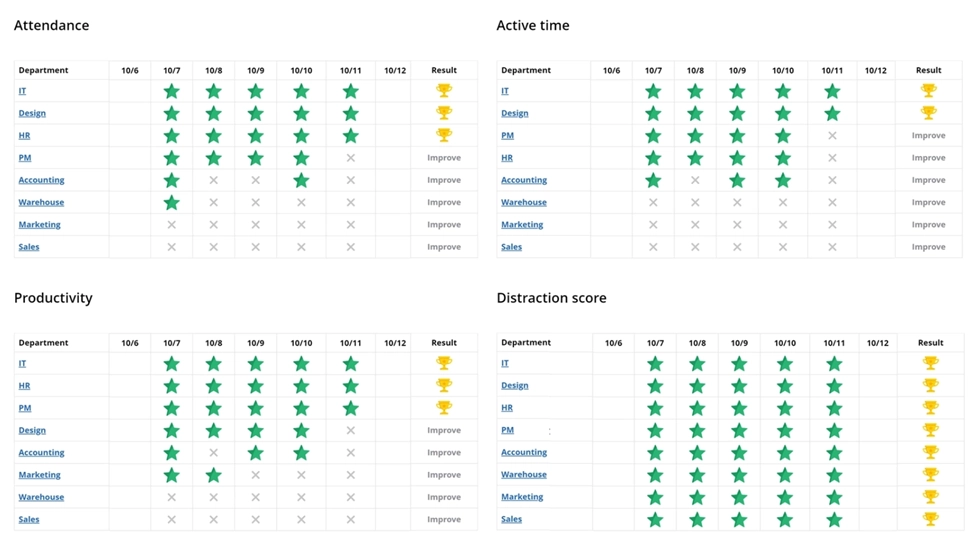
That last point is where most engagement programs stall. A once-a-year survey captures a snapshot, but engagement is shaped by what happens in the weeks between surveys, and most organizations have no read on it. WorkTime closes that gap with non-invasive engagement signals, productivity scores, active versus idle time, attendance, distraction levels, and early burnout patterns, without screenshots or keystroke logging, so managers can see whether their engagement work is actually landing. You can see how this works on our engage employees and leaderboards pages.
WorkTime Leaderboards display achievements and department KPIs in an easy-to-read format, helping employees stay aware of goals, celebrate progress, and remain motivated.
The manager is the most powerful lever in employee engagement, and manager engagement is falling faster than the overall workforce. Fix the manager, and you move the whole team. The following Gallup findings show how the management approach directly influences employee engagement levels.
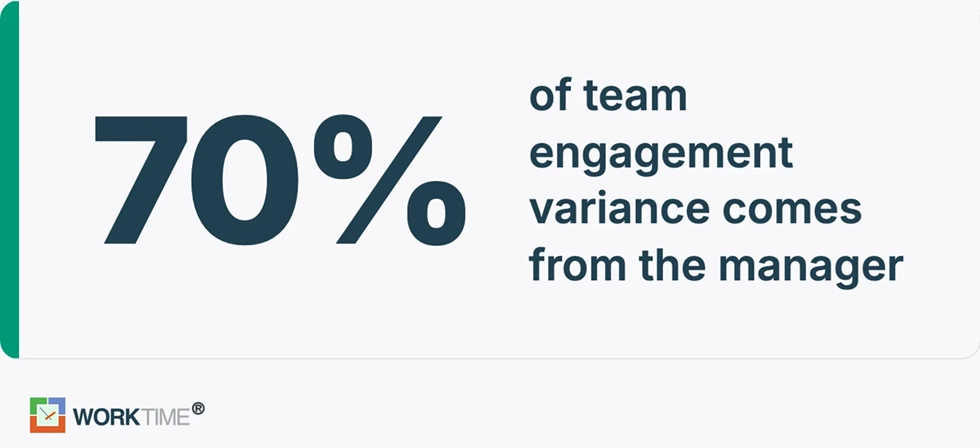
31. Managers account for 70% of the variance in team engagement scores (Gallup).
32. Only 31% of U.S. managers are engaged at work, the same rate as the overall workforce (Gallup).
33. Global manager engagement fell to 22% in the latest reading, down 5 points year over year and 9 points since 2022 (Gallup).
34. Managers under age 35 saw one of the sharpest engagement drops, falling about 5 points in a single year (Gallup).
35. Managers report more daily stress than the people they manage, 45% versus 39%, which weighs on the engagement they pass down to their teams (Gallup).
Employee engagement by work arrangement
Hybrid workers are the most engaged group, ahead of both fully remote and fully on-site employees. Flexibility paired with in-person connection appears to beat either extreme on its own.
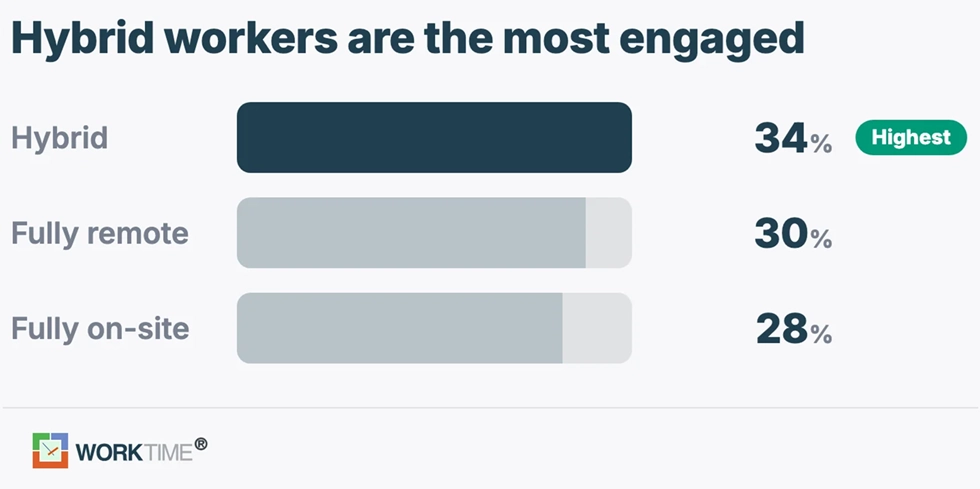
36. Hybrid employees report 34% engagement, the highest of any work arrangement (HR Cloud, using Gallup data).
37. Fully remote employees report 30% engagement (HR Cloud).
38. Fully on-site employees report 28% engagement, the lowest of the three (HR Cloud).
39. Hybrid workers lead largely because the model preserves social connection while keeping flexibility, the two factors that most shape engagement by location (HR Cloud, using Gallup data).
40. Remote work also carries an output advantage in some studies: one Stanford analysis found remote workers were about 13% more productive than their in-office peers, though this figure predates the current hybrid era and should be read as historical (Stanford).
Comparing engagement across locations only works if the measurement method is the same everywhere. Our remote vs. in-office productivity comparison shows how that side-by-side view is built without invasive tracking.
Younger workers are disengaging the fastest. Gen Z and younger millennials have driven much of the recent decline, largely over recognition, resources, and growth.
41. Workers under 35 saw engagement fall about 5 points in a single year, a steeper drop than older workers (Gallup).
42. Younger employees report the largest gaps in feeling cared about and having clear expectations, two of the strongest engagement drivers (Gallup).
43. Gen Z and younger millennials most often cite lack of recognition, lack of resources, and limited opportunities to learn and grow as reasons for disengaging, per Gallup data reported by Fortune.
44. Younger workers also report a weaker connection to their company's mission and purpose than older cohorts (HR Dive).
45. The generational gap reinforces the development finding: career growth is the engagement lever younger workers care about most (Fortune).
Employee engagement by industry
Engagement varies widely by industry, and several knowledge-work sectors led the most recent decline. The 70% best-practice ceiling holds across every industry, which means the average is a management gap, not an industry ceiling.
46. Gallup attributes much of the recent U.S. drop to declines in finance and insurance, transportation, technology, and professional services (Gallup).
47. Best-practice organizations sustain 70% engagement, more than double the U.S. average, which shows the ceiling is set by management rather than industry (Gallup).
48. Because best-practice organizations reach 70% in every sector, the gap between industries reflects management quality more than the nature of the work itself (Gallup).
Recognition, communication, and well-being
Beyond the three core drivers, a cluster of workplace factors shapes engagement: how often people are recognized, how well leaders communicate, and how employees feel day to day.
49. About 34% of employees worldwide are "thriving" in overall well-being, leaving most workers struggling or merely getting by (Gallup).
50. Notably, 41% of employees experienced significant stress the previous day, the kind of well-being drag that pulls engagement down over time (Gallup).
Improve employee
engagement - stress-free!
51. Poor workplace communication costs U.S. businesses an estimated $1.2 trillion a year, or about $12,506 per employee, according to a Grammarly and Harris Poll report.
52. The same research found communication effectiveness fell 12% year over year, while the productivity lost to poor communication rose 15% (Grammarly).
53. About 88% of organizations say they are concerned about retention, and they rank providing learning opportunities as their number-one strategy to keep employees (LinkedIn).
54. Gallup's engagement-to-performance link is drawn from more than 3.3 million employees across 183,806 teams, one of the largest workplace data sets ever analyzed (Gallup).
55. Engagement levels shift measurably from year to year, which is why continuous measurement beats a single annual snapshot for spotting decline early (Gallup).
The bottom line
Employee engagement is at a 10-year low in the U.S., and a five-year low worldwide, and the cost is measurable: roughly $10 trillion in lost global output, higher turnover, and more absences. The data also points to the fix. Managers drive 70% of the variance, and clear expectations, recognition, and development are the levers that move the number.
The organizations that improve engagement do not just survey once a year. They measure continuously and act on what they see. WorkTime brings 26 years of employee monitoring expertise, providing non-invasive workforce analytics that uncover engagement trends, productivity scores, attendance patterns, distraction levels, and burnout indicators - all without screenshots or keystroke logging. Trusted by more than 9,500 organizations, we help companies understand workforce performance and improve employee engagement.
Try WorkTime now!
Frequently asked questions
What percentage of employees are engaged at work?
About 31% of U.S. employees and 20% of employees worldwide are engaged at work, according to Gallup. The U.S. figure is a 10-year low, and the global figure is the lowest since 2020.
Are most employees disengaged?
Most employees are not actively engaged, but only a minority are actively disengaged. In the U.S., 17% are actively disengaged, while the largest group falls into the passive "not engaged" middle. Combined, that means the majority of workers are not fully engaged.
What is the biggest driver of employee engagement?
The manager is the biggest single driver. Managers account for 70% of the variance in team engagement. After the manager, the strongest levers are clear expectations, regular recognition, and opportunities for development.
What is the number one reason employees disengage or quit?
Lack of career growth and development is consistently among the top reasons, especially for younger workers. Gallup data shows that only 30% of employees feel someone at work encourages their development, and that group is far less likely to be engaged or to stay.
What are the 5 C's of employee engagement?
One widely used version of the 5 C's framework is Care, Connect, Coach, Contribute, and Congratulate. It describes the manager behaviors that build engagement, from caring about employees as people to recognizing their contributions. Other versions exist, but most center on the manager's role.
How is employee engagement measured?
Engagement is measured in two ways. The first is survey-based, using validated instruments like Gallup's Q12 to capture how employees feel. The second is behavioral, tracking signals such as productivity scores, active versus idle time, attendance, and distraction levels for a continuous read between surveys.
WorkTime
Employee monitoring software
Non-invasive - the only non-invasive software on the market
25+ years on the market
80+ reports: attendance, productivity, active time, online meetings, remote vs. in-office and more