
TL;DR
- A productivity report has seven core fields: header information, time and attendance, KPIs, a task log, blockers, results, and next steps. Everything else is optional.
- Pick metrics by role, not one company-wide number. Tasks completed, quality, and utilization mean different things for sales, support, and engineering teams.
- Output divided by hours works for repeatable work, not knowledge work. For knowledge roles, pair output with a quality or outcome measure, or the number misleads you.
- Match the cadence to the metric. Review attendance and overtime weekly. Review productivity trends, goals, and engagement monthly or quarterly.
- You do not need surveillance to collect the data. A full productivity report can be built from non-invasive metrics, with no screenshots, screen recording, or keystroke-content logging.
In this article
Presented by WorkTime
WorkTime is non-invasive employee monitoring software with 80+ reports for analyzing workforce productivity, attendance, application usage, and performance trends.
What is an employee productivity report?
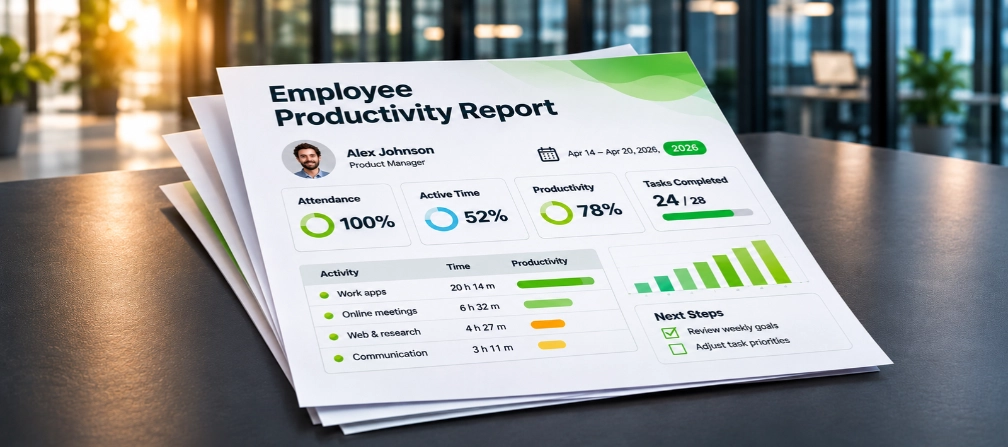
An employee productivity report is a document that tracks an employee's or team's output, hours, and progress toward goals across a day, week, month, or quarter. Managers use it as input for performance reviews, to spot workload imbalance and burnout risk, and to catch time lost to low-value activity. Employees use it to show their work and stay clear on what is expected. Reports are written at four levels: individual, team, department, and company. An individual report shows one person's tasks and KPIs. A team or department report rolls those up to compare groups and find where output is lagging. A productivity report is not a performance review. A productivity report measures output over a defined period and is mostly numbers and tasks. A performance review evaluates the person over a longer horizon and weighs skills, behavior, and growth. The productivity report is one of the inputs a reviewer reads, not the review itself.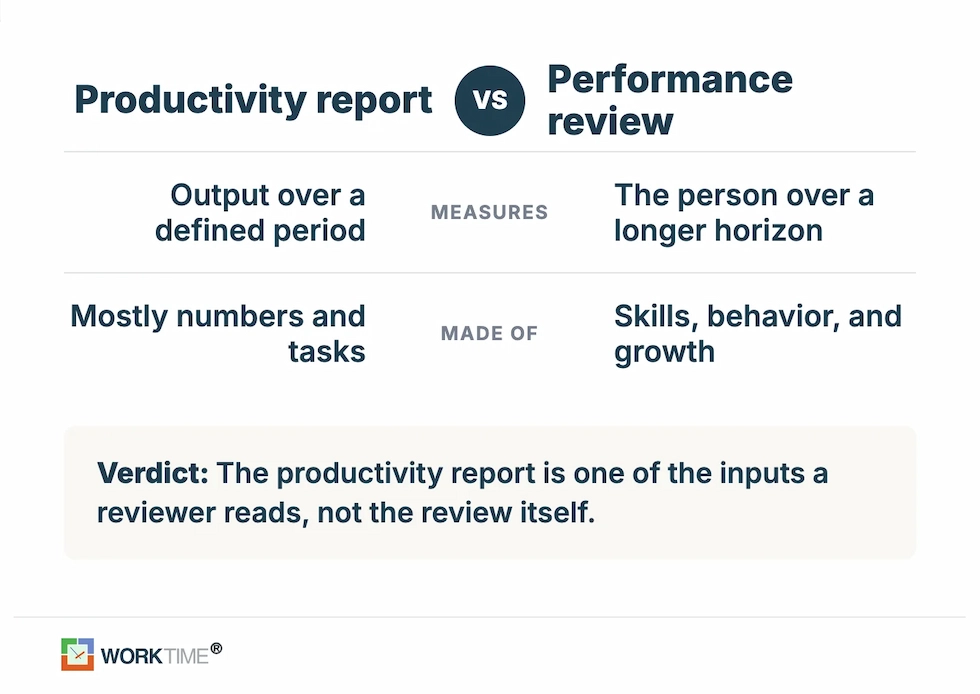
What to include in an employee productivity report
Every effective productivity report covers seven fields. Keep each one short, and let the KPIs and task log carry the detail.- Header information: Employee name, job title, department, manager, and the reporting period (the date range the report covers).
- Time and attendance: Hours scheduled versus hours worked, and billable versus non-billable time where it applies.
- Key performance indicators (KPIs): The target for each metric next to the actual result, so the gap is obvious at a glance.
- Task or project log: Each task or project, its status (Completed, In Progress, Blocked, or Deferred), and the time spent on it.
- Blockers and challenges: Anything that slowed progress or needs a manager to step in. This field is what turns a report into a conversation.
- Results and notes: A short read of how the numbers compare to the goals and why.
- Next steps and goals: The priorities and deliverables planned for the coming period.
Employee productivity report template (copy and paste)
Here is a complete employee productivity report template that captures all seven fields in one place. Copy it into a document or spreadsheet and fill in the values for your reporting period.Header
| Field | Entry |
|---|---|
|
Employee name |
|
|
Job title |
|
|
Department |
|
|
Manager |
|
|
Reporting period |
e.g., Oct 1 to Oct 31, 2026 |
|
Hours scheduled |
|
|
Hours worked |
|
|
Billable / non-billable |
|
Key performance indicators
| Metric | Target | Actual | % to target |
|---|---|---|---|
|
Tasks completed |
40 |
37 |
93% |
|
Quality (accepted outputs) |
95% |
92% |
97% |
|
Utilization |
80% |
76% |
95% |
|
Role-specific KPI |
|
|
|
Task/project log
| Task or project | Status | Priority | Hours | Outcome vs goal |
|---|---|---|---|---|
|
|
Completed |
High |
|
|
|
|
In Progress |
Medium |
|
|
|
|
Blocked |
High |
|
|
Summary
| Summary | Entry |
|---|---|
|
Blockers and challenges |
|
|
Results and notes |
|
|
Next steps and goals |
|
How to fill in the template, step by step
Fill the template in order, from the header down, and record entries as the period runs rather than reconstructing everything at the end. Live entries are more accurate and take less time.- Set the header and reporting period. Name, role, department, manager, and the exact date range. The period decides which tasks and hours belong in this report.
- Choose three to five KPIs that fit the role. Do not track everything. Pick the handful of metrics that fit the role and show whether this person hit their goals.
- Log tasks and status as you go. Add each task with its status and priority during the period, not in one rushed session at the end.
- Record hours worked against hours scheduled. Split billable and non-billable time if your team bills clients or projects.
- Note blockers the moment they appear. A blocker logged in real time gets solved. One remembered a week later does not.
- Calculate each KPI against its target. In a spreadsheet, productivity per employee is output divided by hours worked: enter = output/hours in a cell. Task completion rate is = completed/assigned * 100. Let the sheet do the math, so the report is consistent every period.
- Write the results summary and next steps. Two or three sentences on how the numbers compare to the goals, then the priorities for the next period.
Which productivity metrics to track (by role)
Productivity has one base definition and many role-specific measures. The U.S. Bureau of Labor Statistics defines labor productivity as output divided by the labor hours used to produce it. At the team or individual level, that becomes units or tasks completed divided by hours worked. The catch is that the right output to count depends entirely on the role.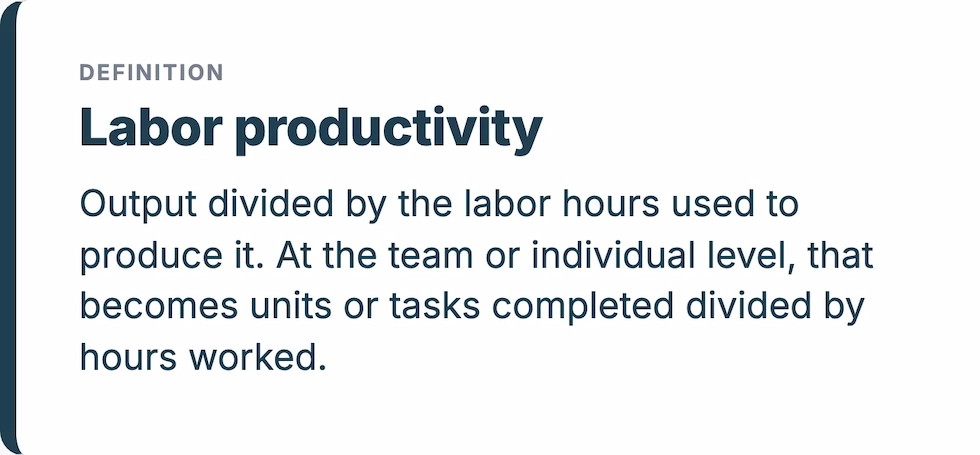
| Metric | Formula | Best for |
|---|---|---|
|
Task completion rate |
Tasks completed ÷ tasks assigned × 100 |
Most roles |
|
Quality of work |
Accepted outputs ÷ total outputs × 100 |
Knowledge and creative work |
|
Work efficiency (utilization) |
Output ÷ time or resources |
Agencies, consultants, support |
|
Revenue per employee |
Revenue ÷ average headcount |
Sales, leadership views |
|
Goal attainment |
Objectives completed ÷ objectives set × 100 |
Any role with set goals |
- Sales: Revenue per employee, conversion rate, and quota attainment.
- Support: Tickets resolved, first-response time, and customer satisfaction (CSAT).
- Knowledge and engineering: Goal attainment, quality of work, and cycle time, not lines of code or hours logged.
- Operational and manual roles: Units produced, error rate, and utilization.
Measuring knowledge work the right way
Output divided by time is a clean measure for repeatable work and a misleading one for knowledge work. Atlassian's analysis of the problem with productivity metrics makes the point directly: productivity has always measured machines and capital well, but more output from a person does not necessarily mean better results. A developer who ships twice the code may be creating twice the maintenance. The failure mode to avoid is the vanity metric, a number that looks like productivity but only measures activity. Hours logged, messages sent, and meetings attended all rise when someone is busy looking busy, and none of them tell you whether the work mattered. A metric people can game gives them something to game instead of something to deliver. The fix is to pair every activity metric with an outcome metric. Count tasks completed next to the quality of those tasks. Track hours worked next to goal attainment. A report built only on activity measures motion, not results, and it rewards whoever is best at looking busy.
How often to run a productivity report
Run the report on the cadence that matches the metric you are watching, not on a single fixed schedule for everything.- Daily: A short task log, used for standups and fast-moving project work.
- Weekly: Attendance, overtime, and blockers. These change quickly and need a quick response.
- Monthly: KPI trends and goal progress. A month is long enough to see a pattern and short enough to correct it.
- Quarterly: The rollup that feeds performance reviews, plus engagement and development goals.


Build it manually or generate it automatically
A manual template is free and flexible, but it has limitations that can affect its usefulness. It depends on self-reported data, doesn’t provide real-time updates, takes time to complete, and makes activity figures easy to inflate. By the time a monthly report is compiled by hand, the month is already over. The alternative is to generate the report from data the computer already captures. WorkTime does this as non-invasive employee monitoring software: it measures productivity scores, active and idle time, attendance, and application usage on its own, then fills the same fields this template uses. Its scheduled reports arrive in an inbox on whatever cadence you set, and every report exports to HTML or CSV, so nothing gets typed by hand.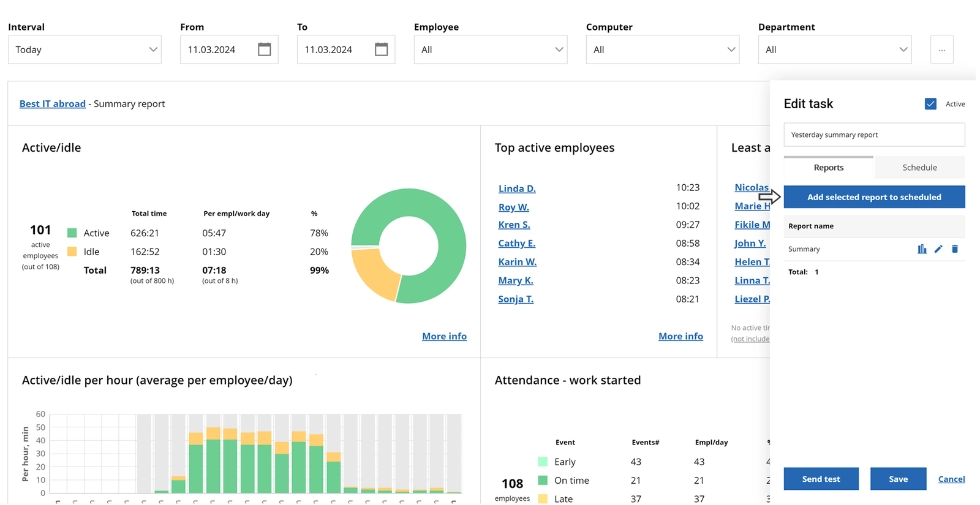
Get regular workforce performance updates without checking reports manually!
Book demo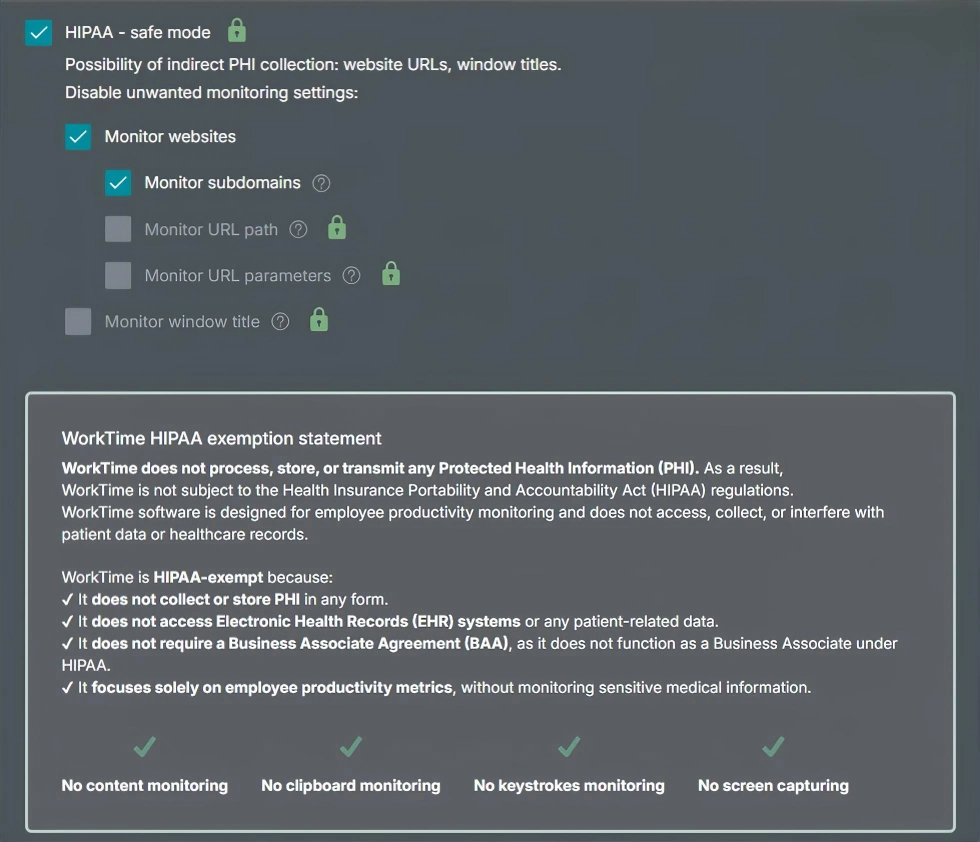

WorkTime's HIPAA-safe mode adds an extra layer of protection by restricting data sources that could indirectly expose protected health information (PHI).
Start free trialThe bottom line
A good employee productivity report template gives you the structure in seven fields, but the value comes from two choices the template cannot make for you: picking outcome metrics that fit each role and collecting the data in a way your team trusts. Track three to five KPIs, match the reporting cadence to the metric, and pair every activity number with a measure of whether the work actually mattered. You can build the report by hand from the template in this guide, or let it generate itself. WorkTime is non-invasive employee monitoring software that turns productivity reporting into a scheduled, automatic output across more than 80 report types, so your managers read the numbers instead of assembling them, and your team is never surveilled to produce them. You can start a free 14-day trial to see the reports built from your own team's data.