


TL;DR
- 82% of working adults have no structured time-management system (Acuity Training, UK survey, 2025).
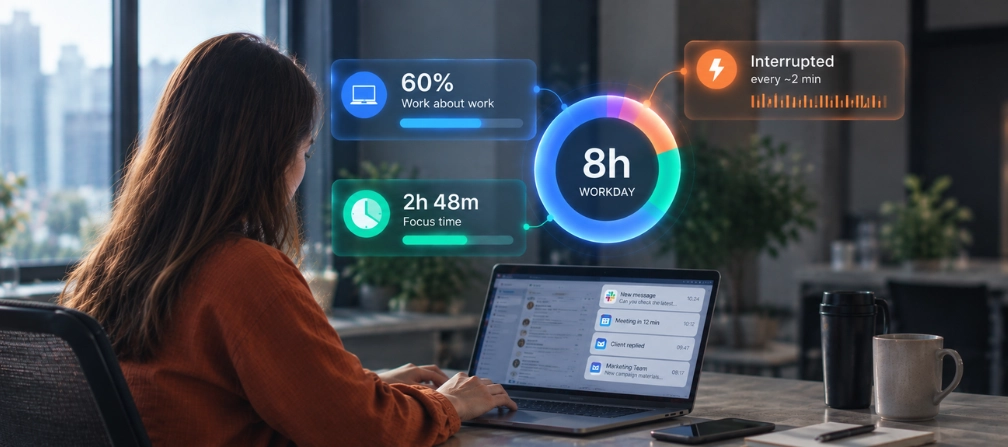
- Knowledge workers get about 2 hours 48 minutes of productive device time a day (RescueTime telemetry, 2019).
- Workers are interrupted roughly every 2 minutes across the day (Microsoft Work Trend Index telemetry, 2025).
- It takes 25 minutes 26 seconds to return to a task after switching away from it (Mark and colleagues, US study, 2005).
- Professionals spend about 14.8 hours a week in meetings (Reclaim.ai, 2024).
- Employees spend 60% of the day on "work about work" rather than skilled work (Asana, seven-country survey, 2021).
- 80% to 95% of college students procrastinate (Steel meta-analysis, 2007).
- Better time management is moderately linked to job performance, r ≈ .25, across 158 studies of 53,957 people (PLOS ONE meta-analysis, 2021).
- WorkTime helps identify where focus is lost. Its distraction score reports combine signals such as unproductive activity, frequent app/website switching, too many open tabs, and idle time.
In this article
Presented by WorkTime
The article is presented by WorkTime, delivering non-invasive performance analytics to more than 9,500 organizations.
Time management system adoption statistics
Most people run their day with no system at all. Fewer than one in five working adults use a structured time-management framework, and the rest rely on lists, their inbox, or instinct.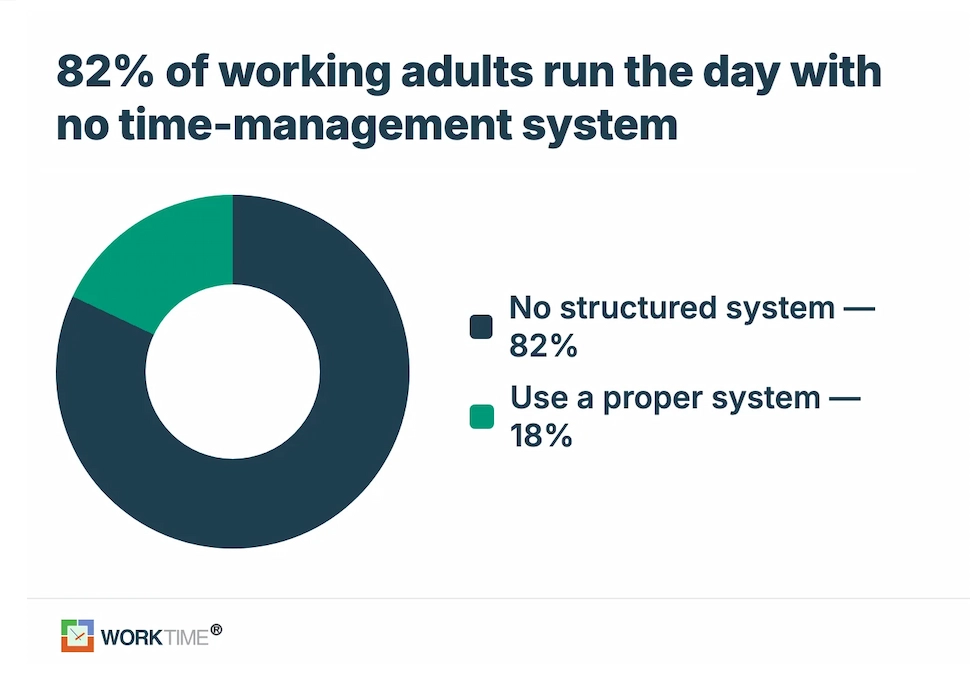
| Statistic | Population | Year | Source |
|---|---|---|---|
|
18% use a proper time-management system |
UK working adults (n=500) |
2025 |
|
|
82% have no structured time-management system |
UK working adults (n=500) |
2025 |
Acuity Training |
|
48% use a to-do list, up 10 points over two years |
UK office workers |
2024 |
|
|
24% use their email inbox as the main task tracker |
UK office workers (self-reported) |
2024 |
Timewatch |
|
25% "wing it" and handle whatever seems most urgent |
UK office workers (self-reported) |
2024 |
Timewatch |
How workers actually spend their day
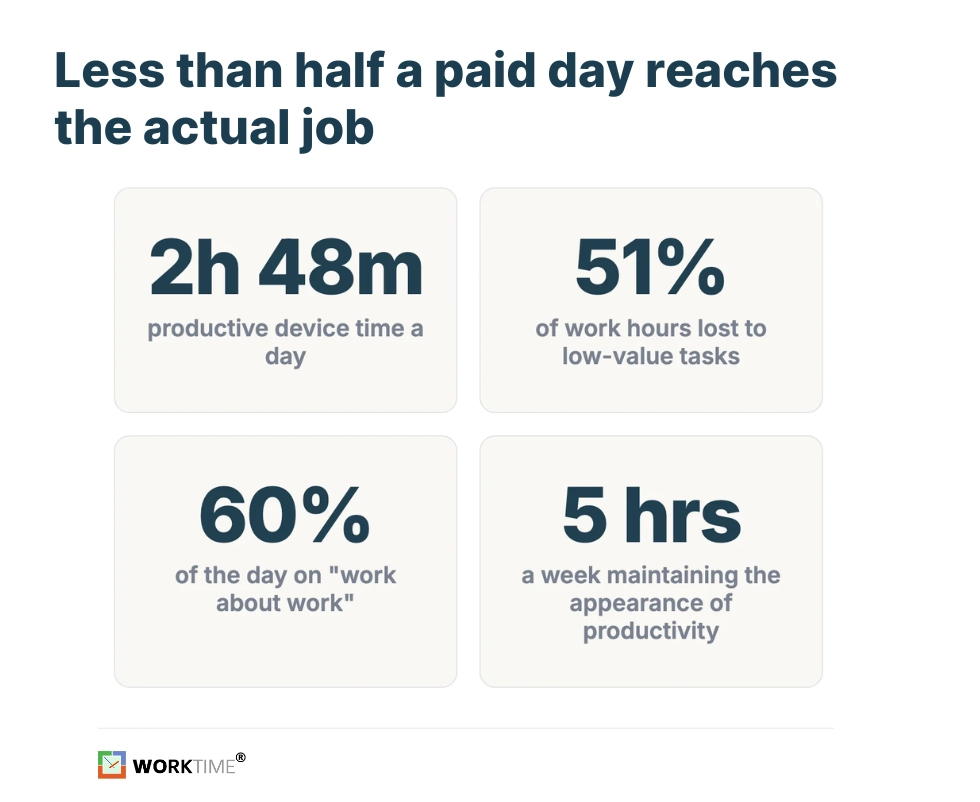
Less than half of a paid day goes to the actual job. Telemetry from RescueTime, which measured 185 million hours of logged device time, put focused productive work at under three hours.| Statistic | Population | Year | Source |
|---|---|---|---|
|
2 hours 48 minutes of productive device time per day |
RescueTime users, 185M hours logged |
2019 |
|
|
2 hours 53 minutes "productive" (self-reported, widely quoted) |
UK office workers (n=1,989) |
2013 |
|
|
8.1 hours worked on days worked; 8.5 on weekdays, 5.5 on weekend days |
US employed, ages 15+ |
2025 |
|
|
51% of work hours lost to low-value tasks |
US knowledge workers (n=2,000) |
2025 |
|
|
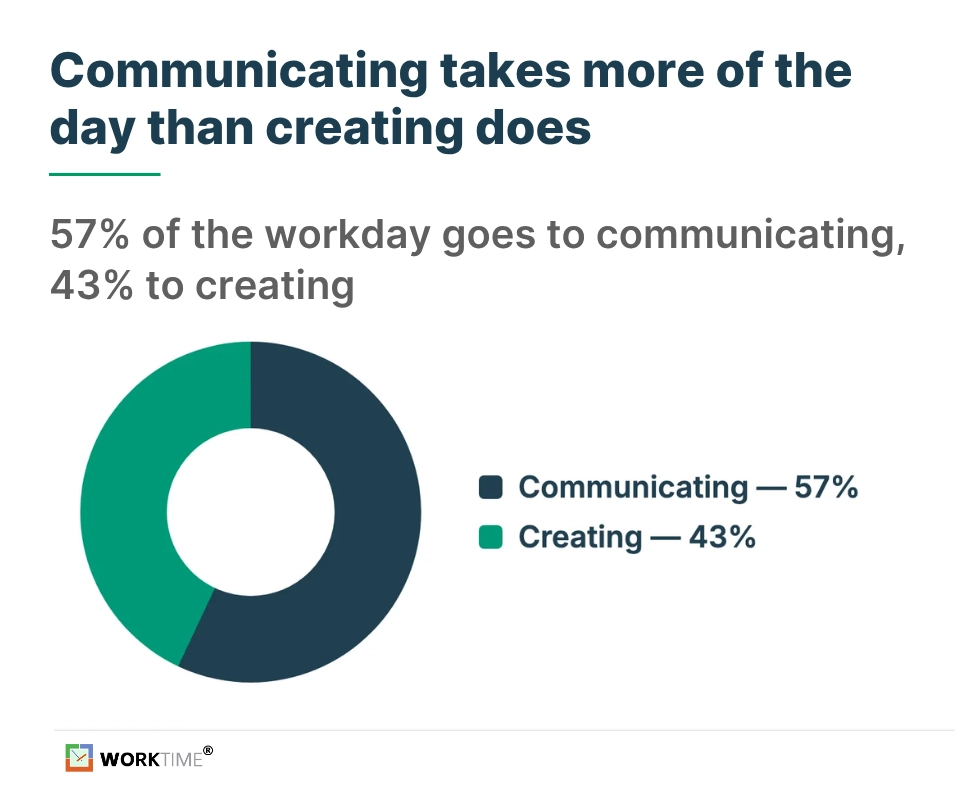
57% of time spent communicating vs 43% creating |
Microsoft 365 users (31,000 surveyed + telemetry) |
2023 |
|
|
60% of the day on "work about work" |
Knowledge workers, 7 countries (n=13,000+) |
2021 |
|
|
5 hours a week spent maintaining the appearance of productivity |
Workers (survey) |
2026 |
Task-switching and refocus-time statistics
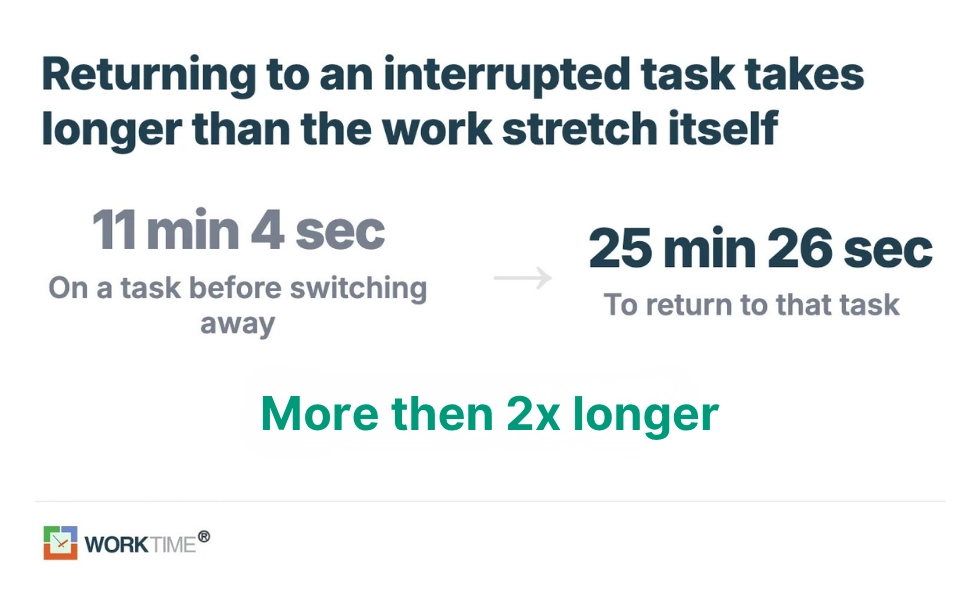
One interruption costs far more than the minute it takes. In a measured study of information workers, the average time to return to the original task after a switch was over 25 minutes.| Statistic | Population | Year | Source |
|---|---|---|---|
|
25 minutes 26 seconds to resume an interrupted task |
24 US information workers, one high-pressure firm |
2005 |
|
|
11 minutes 4 seconds on a task before switching |
24 US information workers, one firm |
2005 |
Mark, Gonzalez, and Harris |
|
57.1% of work segments were interrupted |
24 US information workers, one firm |
2005 |
Mark, Gonzalez, and Harris |
|
Up to 40% of productive time lost to switching between tasks |
Laboratory estimate (US) |
2001 |
American Psychological Association, citing Meyer |
|
40.1% of the workday spent multitasking |
RescueTime users, 185M hours |
2019 |
RescueTime |
Workplace interruption statistics
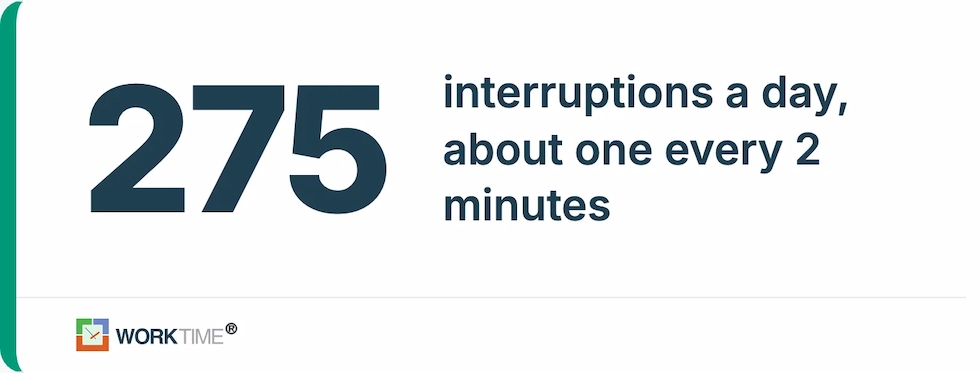
The modern workday is interrupted more often than it is worked. Microsoft's telemetry across knowledge workers found a disruption roughly every two minutes once emails, meetings, and messages are combined.| Statistic | Population | Year | Source |
|---|---|---|---|
|
Interrupted about every 2 minutes (roughly 275 times a day) |
Knowledge workers, telemetry across 31 markets |
2025 |
|
|
57% of meetings are ad hoc, with no calendar invite |
Knowledge workers, telemetry |
2025 |
Microsoft Work Trend Index |
|
Interrupted 50 to 60 times a day (expert estimate, not a study) |
Media estimate |
2015 |
Gloria Mark, via Acuity Training |
Meeting time management statistics
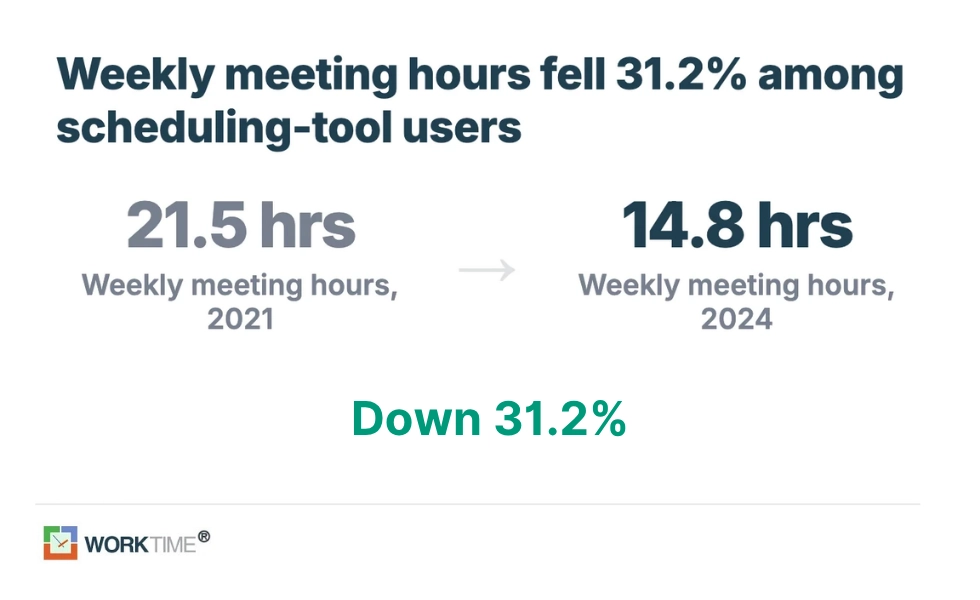
Meetings are the largest scheduled time cost, and whether the trend is up or down depends entirely on who you measure. Self-selected scheduling-tool users report meeting hours falling; broad telemetry shows meetings creeping later and across more time zones.| Statistic | Population | Year | Source |
|---|---|---|---|
|
14.8 hours a week in meetings, down 31.2% from 21.5 hours in 2021 |
1,300+ professionals, US-leaning (self-selected) |
2024 |
|
|
Average meeting length 51.9 minutes, up from 50.6 in 2021 |
1,300+ professionals (self-selected) |
2024 |
Reclaim.ai |
|
Meetings take up 37% of the average professional's schedule |
1,300+ professionals (self-selected) |
2024 |
Reclaim.ai |
|
$29,129 per employee per year spent in meetings |
1,300+ professionals, US-leaning |
2024 |
Reclaim.ai |
|
157 hours per person per year lost to unnecessary meetings |
Knowledge workers, 7 countries (n=13,000+) |
2021 |
Asana Anatomy of Work |
|
North America: 40% of meetings run over an hour; Europe: 67% |
Leaders and executives, global (n≈2,500) |
2023 |
|
|
Meetings after 8 pm up 16% year over year |
Knowledge workers, telemetry |
2025 |
Microsoft Work Trend Index |
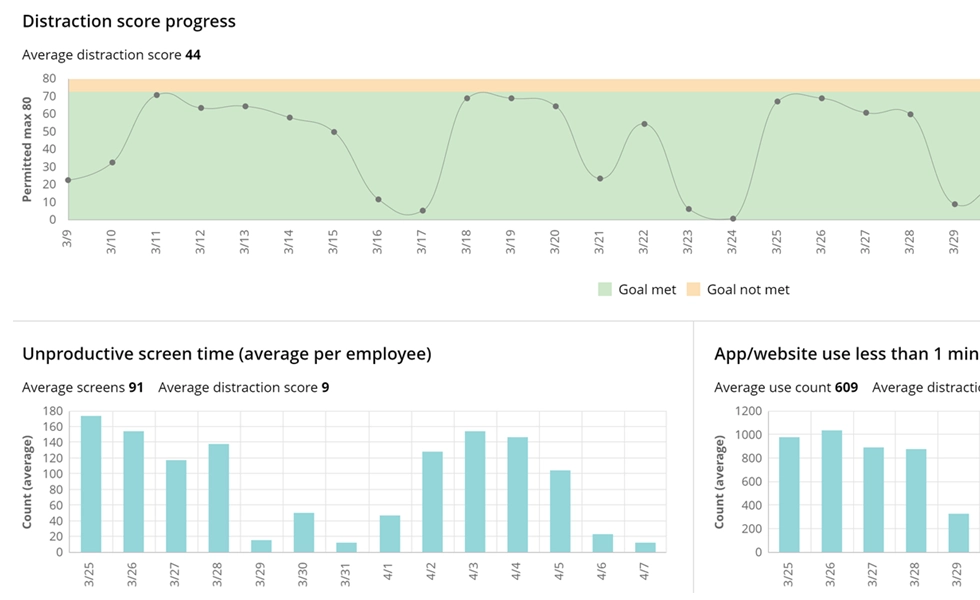

Want to know where distractions are coming from? Analyze employee and department distraction levels alongside online meeting activity to see the bigger picture.
Start free trialEmail and communication load statistics
Communication tools now consume more of the day than focused work. The typical knowledge worker receives well over a hundred emails and checks messages every few minutes.| Statistic | Population | Year | Source |
|---|---|---|---|
|
117 emails received per day, most read in under 60 seconds |
Knowledge workers, telemetry |
2025 |
Microsoft Work Trend Index |
|
153 Teams messages sent or received per weekday |
Knowledge workers, telemetry |
2025 |
Microsoft Work Trend Index |
|
Checks email or chat every 6 minutes |
RescueTime users |
2019 |
RescueTime |
Deep-work and focus-time statistics
Sustained focus is now the exception. 40% of knowledge workers never get a single uninterrupted 30-minute block of focus time in a day, based on RescueTime device telemetry (2019). The long, quiet stretch that skilled work depends on rarely survives a workday of email, chat, and meetings.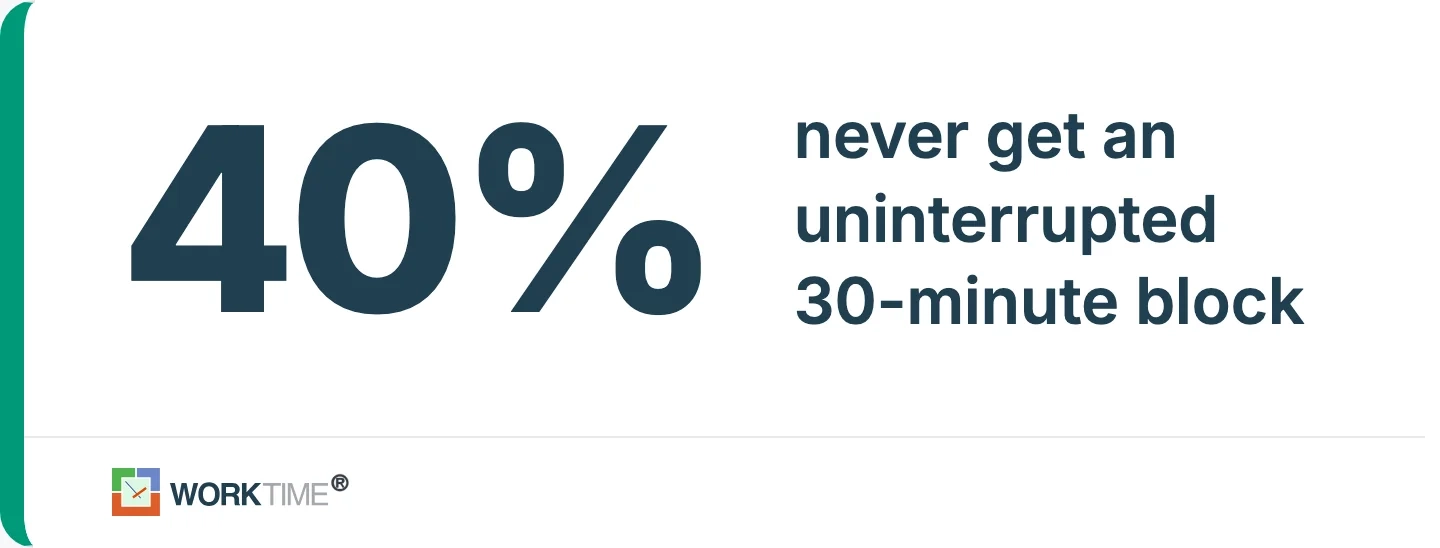
Procrastination statistics
Procrastination is close to universal, and for a fifth of adults it is chronic. The most rigorous numbers come from a meta-analysis of the research literature.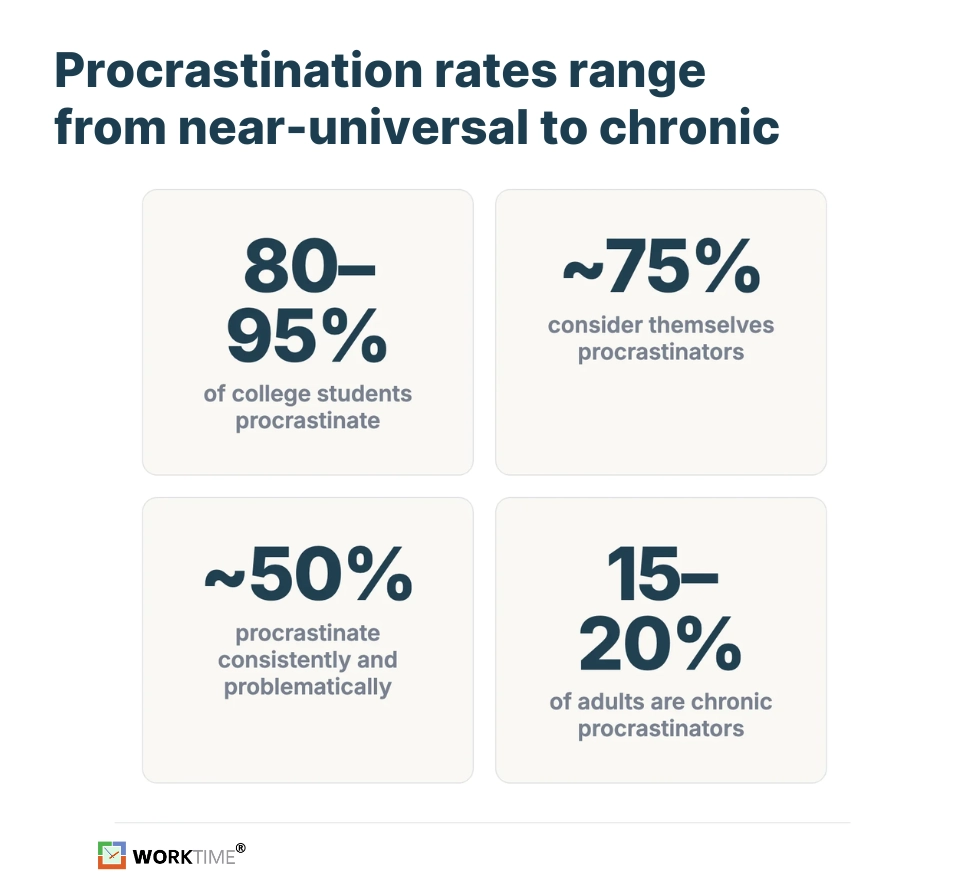
| Statistic | Population | Year | Source |
|---|---|---|---|
|
80% to 95% of college students procrastinate |
College students (Western/US) |
2007 |
|
|
About 75% consider themselves procrastinators |
General adults (Western/US) |
2007 |
Steel meta-analysis |
|
About 50% procrastinate consistently and problematically |
College students (Western/US) |
2007 |
Steel meta-analysis |
|
15% to 20% of adults are chronic procrastinators |
General adults (Western/US) |
2007 |
Steel meta-analysis |
Time management methods and what works
The popular frameworks help, but the trait that predicts good time management most is not a method at all. In the largest study available, conscientiousness was the strongest single correlate.| Statistic | Population | Year | Source |
|---|---|---|---|
|
Eisenhower Matrix and Pomodoro report the highest sense of control |
UK working adults (n=500) |
2025 |
Acuity Training |
|
50% use components of the Eisenhower Matrix |
Workers, online survey |
2026 |
Clockify |
|
92% use components of the Eisenhower Matrix |
Workers, online survey |
2026 |
|
|
Conscientiousness is the strongest correlate of good time management, r = 0.451 |
158 studies, 53,957 people (international) |
2021 |
The payoff of better time management
Across the biggest body of evidence available, time management genuinely moves performance and well-being, modestly but reliably. The same meta-analysis that ranked conscientiousness first quantified the payoff.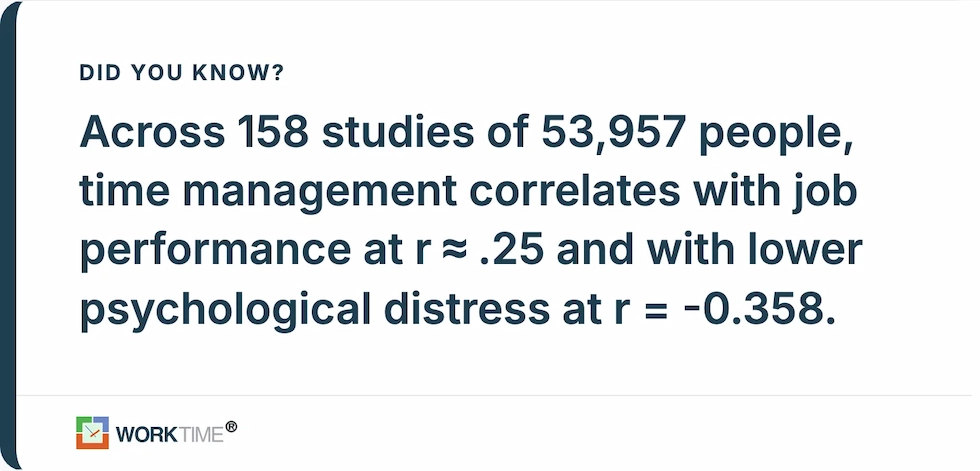
| Statistic | Population | Year | Source |
|---|---|---|---|
|
Time management correlates with job performance, r ≈ .25 (moderate) |
158 studies, 53,957 people |
2021 |
PLOS ONE meta-analysis |
|
Time management correlates with lower psychological distress, r = -0.358 |
158 studies, 53,957 people |
2021 |
PLOS ONE meta-analysis |
|
About 90% say better time management would raise their productivity |
Survey respondents (roundup) |
2026 |
|
|
Conscientiousness is the strongest correlate of good time management, r = 0.451 |
36% of deadlines are missed each week |
2021 |
Asana Anatomy of Work |
What poor time management costs
The money figures everyone quotes are real, but they are old. Treat them as order-of-magnitude, not current, and never quote them without the year. Source: Doodle State of Meetings 2019.| Statistic | Population | Year | Source |
|---|---|---|---|
|
$541 billion global cost of pointless meetings |
US, UK, Germany, Switzerland |
2019 |
|
|
77% of workers reported work-related stress in the past month |
US workers |
2023 |
How time management has changed over time
The long-run picture is fragmentation rising even as scheduled meeting hours fluctuate. The clearest single time series is the daily commute, tracked the same way by the US Census every year. Source: US Census American Community Survey, 1-year estimates. The other long-run shifts each come from a single source measured consistently; where two sources disagree, they are shown separately rather than merged.| Metric | Earlier | Later | Population | Source |
|---|---|---|---|---|
|
Daily gaming and computer leisure |
25 min/day (2015) |
37 min/day (2025) |
US, ages 15+ |
US BLS American Time Use Survey |
|
Weekly meeting hours, self-selected users |
21.5 hrs (2021) |
14.8 hrs (2024) |
Reclaim.ai users |
Reclaim.ai |
|
Cross-timezone meetings, broad telemetry |
Baseline 2021 |
Multi-timezone meetings up 35% since 2021 |
Knowledge workers, telemetry |
Microsoft Work Trend Index |
|
Time management's measured performance benefit |
Smaller in the 1980s |
Larger by 2019 (B=.0106, p<.01) |
Meta-analysis, 1980s to 2019 |
PLOS ONE meta-analysis |
Remote vs. in-office time use
Remote work is now a structural share of the workweek, concentrated in higher-educated roles. Government data tracks both how many work from home and how the share has climbed. Source: US BLS Current Population Survey, March 2026.| Statistic | Population | Year | Source |
|---|---|---|---|
|
22.6% of workers teleworked (women 24.9%, men 20.5%) |
US workers |
2026 |
|
|
35% worked at home some or all of the day (women 38%, men 31%) |
US employed, 15+ |
2025 |
US BLS American Time Use Survey |
|
50+ messages sent or received outside business hours |
Knowledge workers, telemetry |
2025 |
Microsoft Work Trend Index |
Student time management statistics
For students, the gap is even wider than for the workforce. Most say they struggle to organize their time, and procrastination rates run higher than in the general adult population. Sources: College Success Plan 2025 and Clockify 2026The bottom line
The numbers point to a common problem: much of the workday is lost to interruptions, meetings, context switching, and other low-value activities. Fewer than one in five people follow a consistent system for managing their time, while focused work often lasts less than three hours a day. At the same time, some of the biggest productivity drains, switching between tasks and attending meetings, rarely appear on a timesheet. Until businesses understand where the workday actually goes, it is difficult to identify where time can be recovered. That visibility is what WorkTime has given HR and IT teams at 9,500+ organizations since 1998: non-invasive workforce analytics with no screenshots, no keystroke-content logging, and no screen recording, plus more than 80 productivity reports built on the data. It shows how time is spent across remote and in-office teams and where meeting load is quietly eating the week, alongside the wider set of employee monitoring statistics worth tracking. You can try WorkTime free for 14 days to see where your team's time is going.