
TL;DR
- Global employee engagement fell to 20% in 2025, the lowest since 2020, costing the global economy an estimated $10 trillion in lost productivity.
- The average worker is productive for 5 hours 56 minutes per day, leaving a 54-minute gap that translates to billions in productivity losses across the full team.
- AI adoption reached 80% of employees, yet focus efficiency dropped to a three-year low of 60%, showing that more AI tools do not automatically boost productivity.
- Presenteeism costs employers 10 times more than absenteeism. Office workers average 57.5 unproductive days per year at their desks, compared to 4 absent days.
In this article
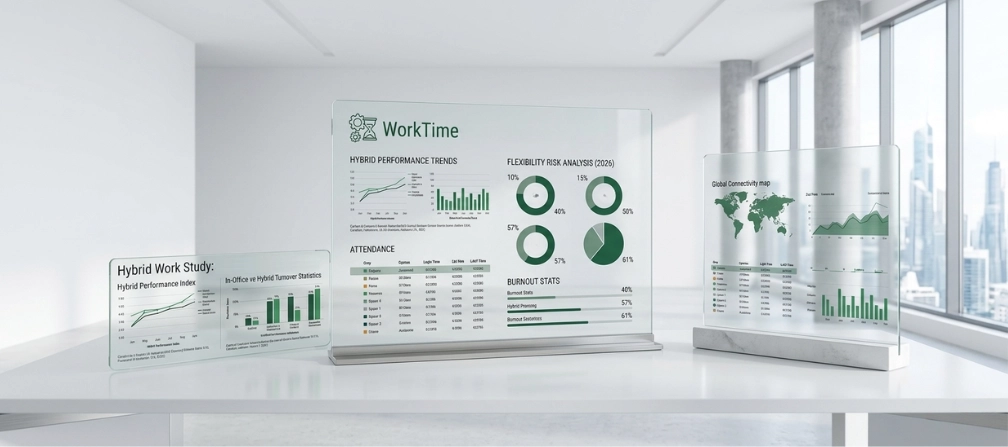
Brought to you by WorkTime, a non-invasive employee monitoring solution with 25+ years of experience, delivering in-depth productivity analytics through a privacy-safe approach.
Top 30+ statistics & trends in the workplace
1. Total factor productivity increased 0.8% in the private nonfarm business sector in 2025. Output grew 2.6% while combined inputs rose 1.7%, according to the Bureau of Labor Statistics. This marks moderate but positive overall labor productivity growth. 2. Output per hour rose 1.8% in Q4 2025. Unit labor costs increased 4.4% in the same quarter. According to BLS labor statistics, rising compensation is compressing margins even as output per hour improves (BLS, March 2026). 3. Manufacturing productivity fell 2.5% in Q4 2025. This was the largest increase in manufacturing unit labor costs since Q3 2022. The decline in manufacturing highlights uneven productivity growth across sectors, with service industries showing stronger gains than goods-producing sectors (Bureau of Labor Statistics). 4. Labor productivity rose in 48 states and the District of Columbia in 2024. Output increased in all 50 states, and hours worked grew in 29 states. State-level data helps track regional employee productivity trends and identify which labor market conditions support strong productivity growth.Employee engagement and employee productivity
6. Only 20% of global employees were engaged in 2025. This marks the first time Gallup recorded two consecutive years of decline. Each point represents about 21 million workers worldwide. When so few employees are engaged in their roles, the downstream effects on employee productivity are enormous (Gallup, 2026). 7. Low employee engagement costs the global economy $10 trillion in 2024. That figure equals roughly 9% of global GDP. Actively disengaged employees cost organizations through higher absenteeism, more errors, and lower customer satisfaction. Improving the employee experience is a financial strategy, not just an HR initiative (Gallup, 2026). 8. Highly engaged business units see 78% less absenteeism and 14% higher employee productivity. Higher employee engagement translates directly into better business outcomes. Teams where employees feel valued and connected deliver fewer errors, stronger retention, and better performance (Gallup).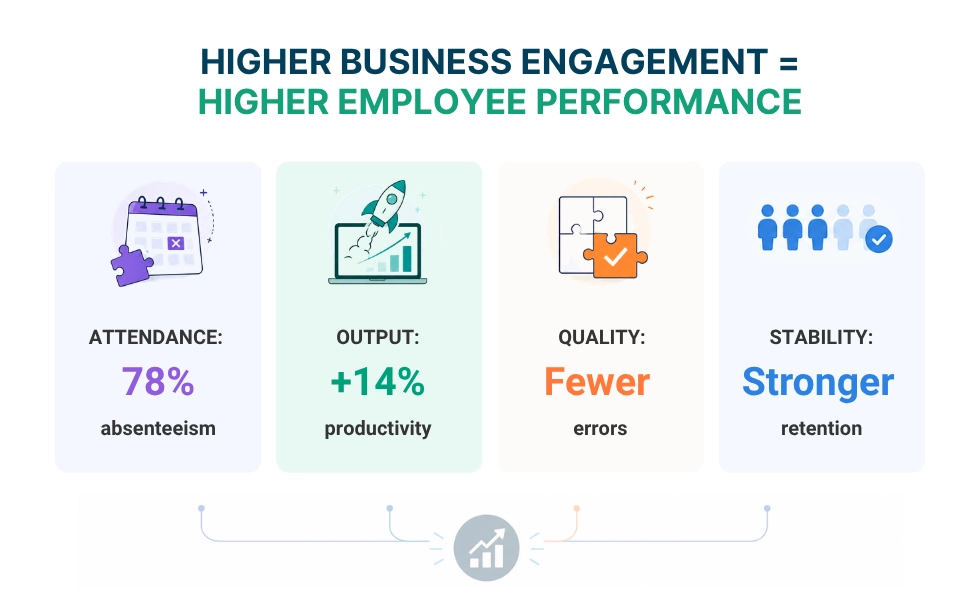
The cost of lost productivity
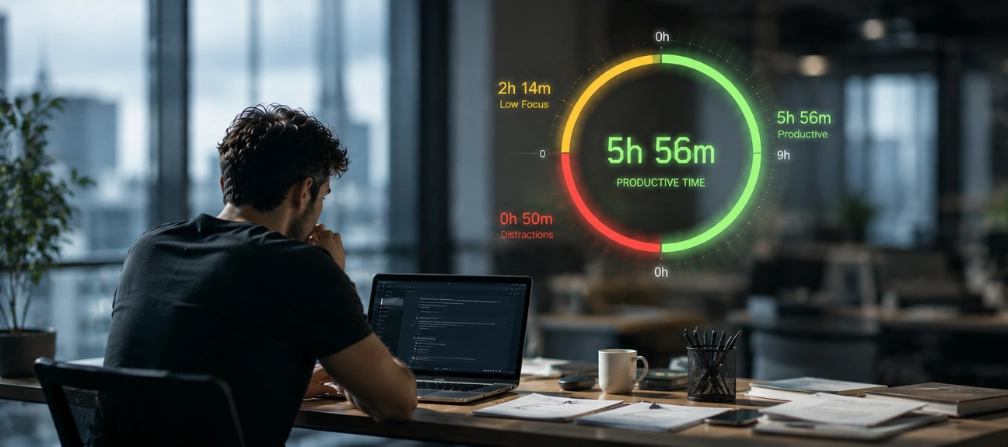
11. Actively disengaged employees cost U.S. employers $483-$605 billion per year. The gap between high-engagement and low-engagement workers shows up in absenteeism, error rates, and attrition. Reducing the number of actively disengaged employees is one of the fastest paths to improved productivity (Gallup). 12. The average employee is productive for about 5 hours and 56 minutes per day. Most organizations target closer to 6 hours and 50 minutes. The built-in 54-minute gap for the average employee each day adds up across the entire workforce. Nearly half of all employees fall short of their productivity targets, and this shortfall reflects structural constraints rather than individual effort. 13. Knowledge workers spend 60% of their time on "work about work." Employees spend time on coordination, status updates, and searching for information most of the day. Knowledge workers and office workers spend more time managing routine tasks and switching between tools than doing the focused work they were hired to perform. 14. Employees lose an estimated 200 hours per year switching between apps. Information search failures account for 45% of productivity losses. These failures lead to 15% of customer delays and 9% of missed deadlines, showing how tool fragmentation can directly affect employee productivity at scale.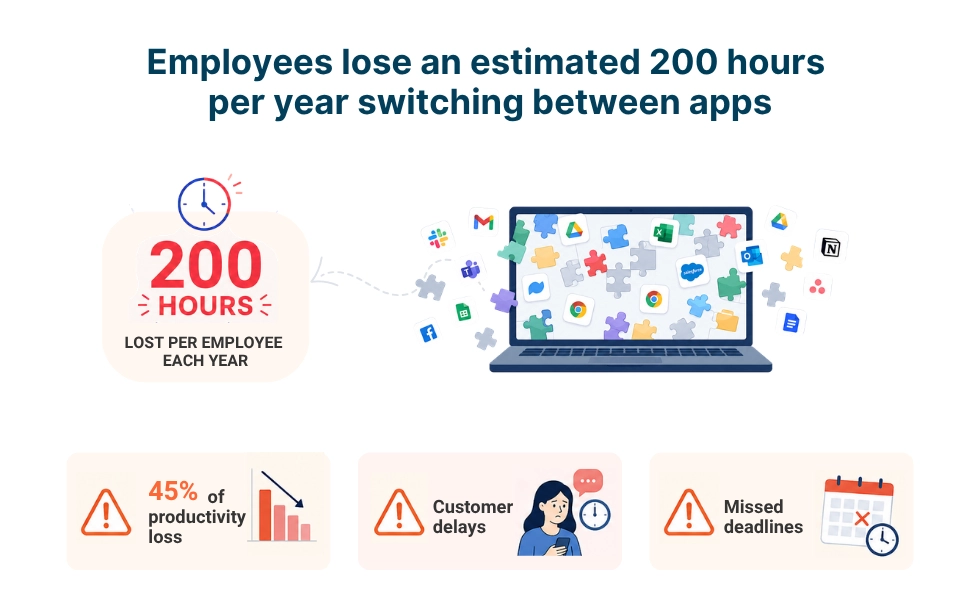
How does flexible work affect employee productivity?
15. About 70% of managers say remote and hybrid work has made their teams more productive. Despite return-to-office mandates, most managers report positive employee productivity outcomes from flexible arrangements. The employee experience in flexible models consistently scores higher than fully in-office setups. 16. Remote workers gain about 29 more productive minutes per day than in-office employees. The average workday was shortened by 36 minutes compared to pre-pandemic norms, yet productivity ticked up by 2%. These workers are producing more in less time. 17. Each 1-point increase in remote workers correlates with a 0.08-point increase in total factor productivity. The BLS analysis across 61 private sector industries found a positive link between remote and hybrid work and total factor productivity at the economy level. The data support flexible work as a productivity driver in the current labor market. 18. Hybrid workers are 33% less likely to quit, with no measurable productivity penalty. The Stanford/Nature trial found that employees working two days per week from home performed as well as those working in the office. They also reported better work-life balance and higher job satisfaction (Bloom et al., 2024). 19. Notably, 41% of employers said flexible work improved productivity, while 16% said it declined. About 43% reported no difference. A positive employee experience in flexible environments depends on clear expectations, visibility into how remote workers perform, and consistent measurement (CIPD UK, 2025).AI and employee productivity
20. AI adoption hit 80%, but focus efficiency dropped to a three-year low of 60%. Collaboration time surged 34%, and multitasking climbed 12%. More AI tools created more outputs to manage, more meetings, and less productive time for focused work.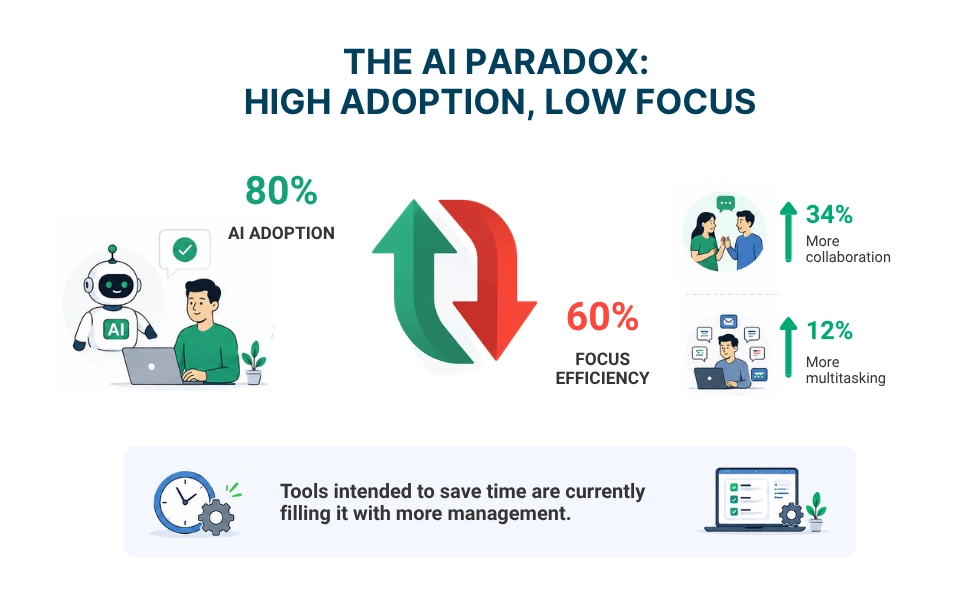
Meetings, distractions, and time waste
24. Office workers face roughly 275 interruptions per day. After each interruption, it takes over 23 minutes to regain focus. The average worker loses hours of productive work daily to context switching alone (Microsoft, 2025). 25. According to the data, 41% of the workday is spent on tasks that employees say add no value. 43% of office workers spend 10+ hours per week on "productivity theater." Unnecessary meetings waste the scarcest resource in any organization: uninterrupted time for focused work (Deloitte, 2025). 26. Notably, 71% of meetings are considered unproductive by senior managers. Meeting time has increased 252% since February 2020. Leaders now spend 23 hours per week in meetings. Companies that protect productive time through meeting-free blocks see measurable productivity rises (HBR).Get rid of never-ending online meetings!
Employee monitoring and workplace productivity
27. Within organizations, 78% of employers use some form of monitoring software. The market is projected to reach $1.47 billion by 2032. As more global employees work remotely, organizations are investing in tools to measure productivity and track work patterns (Fortune Business Insights). 28. Here’s the reality: 56% of monitored employees report stress from surveillance. Nearly half of monitored workers say they would consider quitting if surveillance increased. The monitoring method directly affects employee retention, job satisfaction, and the work environment. A supportive work environment requires monitoring that respects privacy. 29. Across the industries, 43% of employees say monitoring should depend on the role. Employees are not universally opposed to monitoring. They oppose invasive surveillance that captures personal content. Non-invasive approaches that track employee productivity patterns without screenshots or keystroke content logging see significantly higher acceptance. 30. One UK bank saw a 46% increase in active time within 3 days of non-invasive monitoring. An insurance company eliminated $50,000 in false overtime within a year using overtime monitoring. Measuring employee productivity through attendance, active time, and distraction scores provides a positive employee experience for both managers and staff. Non-invasive monitoring tracks what matters without recording what employees see.Instant increase in active time!
+46%
Excellent boost!
Industry
Banking
Employees
170
This UK bank saw a 46% increase in active time within 3 days of non-invasive monitoring! Well done, WorkTime!
Read more
Absenteeism and presenteeism
31. Presenteeism costs U.S. employers approximately $1,500 billion per year. Workers log an average of 57.5 unproductive days per year while present. Employees lose only 4 days to absence. Presenteeism costs 10 times more than absenteeism and is far harder to detect (GCC Insights). 32. Poor health costs U.S. employers $575 billion and 1.5 billion lost workdays annually. 978 million days are lost to absenteeism and 540 million to presenteeism. These productivity losses dwarf most technology investments. Organizations that invest in employee well-being see stronger returns than those that invest only in tools (IBI). 33. Companies using attendance tracking software see almost 20% fewer absences. Automated attendance monitoring removes the manual burden and gives managers clear patterns. Independent workers, contractors, and full-time staff all benefit from consistent tracking that identifies problems before they become costly.Mental health and employee productivity
34. The data highlights that 77% of workers experienced work-related stress in the past year. 57% reported negative impacts on productivity, motivation, and physical health. Mental health issues do not stay contained. They affect employee productivity across every metric an organization tracks (APA, 2023). This is where the approach matters. WorkTime’s transparent, non-invasive monitoring model removes the pressure of being watched, helping teams stay focused without adding unnecessary stress.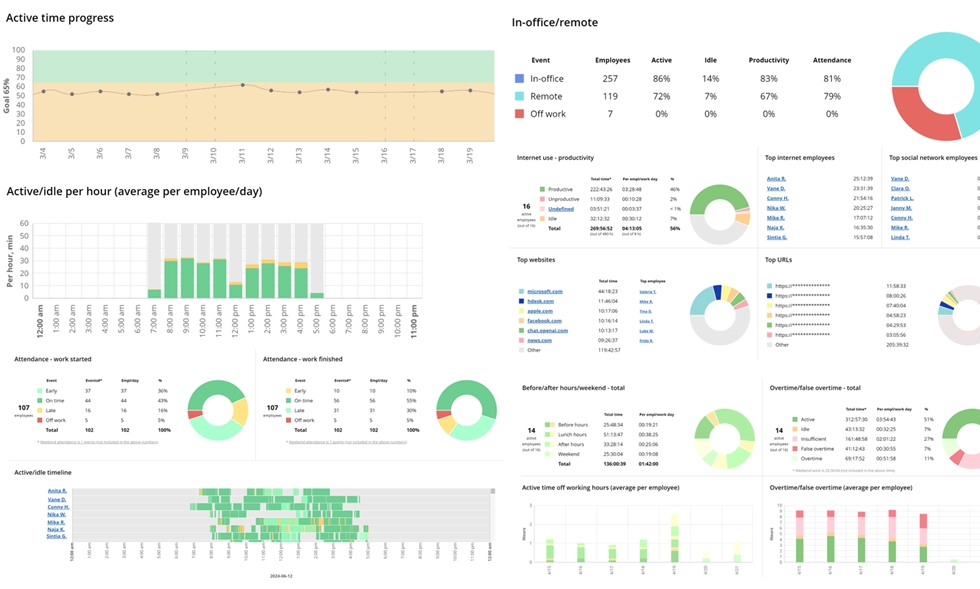

WorkTime offers 80+ comprehensive reports for in-depth performance analytics. All reports are transparent and privacy-safe, with no personal content captured.
Start free trialFinal thoughts
These productivity statistics show that workforce productivity depends more on how work is designed than on how hard people try. The organizations seeing the strongest productivity gains share common patterns. They measure what matters. They protect productive work time. They invest in the employee experience at the manager level. And they use workforce productivity tools that provide visibility without surveillance. WorkTime is non-invasive monitoring software with 26+ years on the market, built to boost productivity by tracking employee productivity, attendance, remote vs. in-office performance, and burnout signs without screenshots, keystroke content, or screen recording. Start a free 14-day trial with all features, no credit card required!Try WorkTime now!