


TL;DR
- Replacing one employee costs roughly 40% of annual salary for frontline workers and over 200% for executives, depending on role level.
- The average US employer now spends $45,236 per departure, a 23% increase from the prior year's $36,723.
- 75% of departures are preventable, and 42% of exiting employees say their manager or organization could have changed the outcome.
- Healthcare, hospitality, and trucking carry the highest costs. Replacing one RN costs $60,090 (NSI). Restaurant turnover exceeds 75% annually. Long-run driver turnover at large truckload carriers averages 92.7%.
- Turnover is climbing again. 50% of US companies expect higher turnover in 2026, up from 33% in fall 2023.
In this article
Presented by WorkTime, delivering transparent workforce analytics that help organizations understand employee performance, address productivity challenges, and build stronger retention strategies.
Headline employee turnover cost statistics
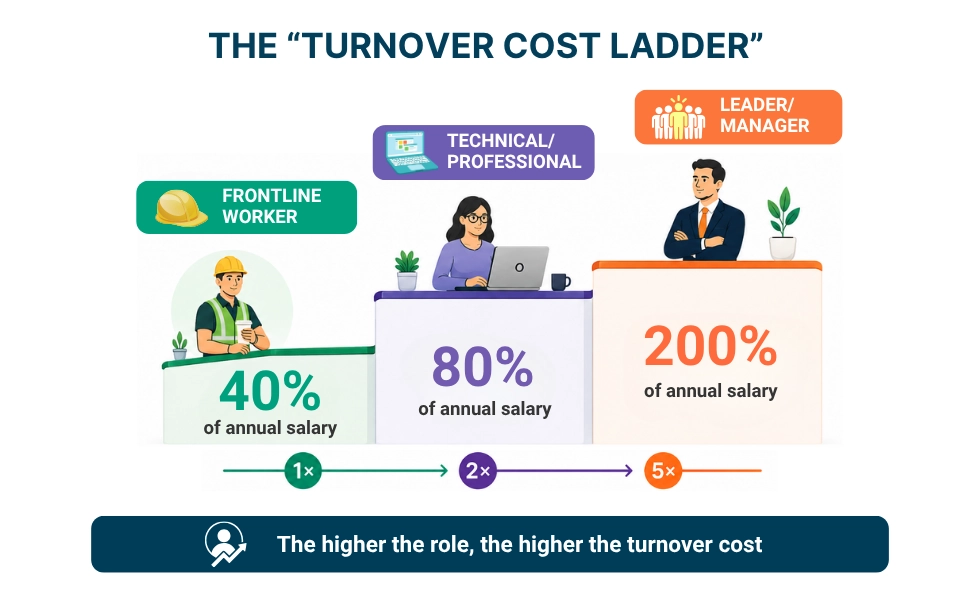
Every turnover conversation starts with these numbers. They set the scale of the problem.1. Replacing an employee costs roughly 40% of annual salary for frontline workers, about 80% for skilled and technical roles, and 200% or more for executives.
2. Gallup also reports that voluntary turnover costs US businesses $1 trillion per year.
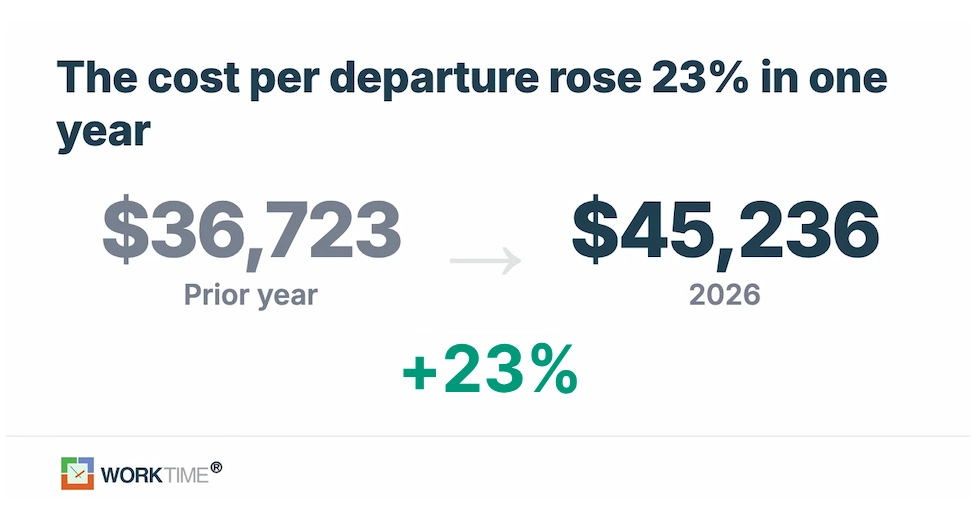
3. The average cost of turnover per worker is $45,236 in 2026, up 23% from $36,723 the prior year, per Express Employment Professionals/Harris Poll.
4. According to SHRM, the average cost-per-hire is $5,475 for non-executive roles and $35,879 for executive roles.
5. Notably, replacement cost equals roughly 6 to 9 months of the departing employee's salary.
6. Washington Center for Equitable Growth reveals that the median turnover cost across 31 case studies is 23.5% of the annual wage.
7. Total turnover cost equals 33.3% of an employee's base salary when all direct and indirect costs are included, per Work Institute.
8. Mercer reports that US voluntary turnover averaged 13.0% across 2,617 organizations surveyed.
9. According to Gallup, low employee engagement costs the global economy an estimated $10 trillion in lost productivity each year.
10. Notably, 50% of US companies anticipate higher turnover in 2026, up from 39% in fall 2024 and 33% in fall 2023.
Cost of turnover by role and seniority level
Turnover costs scale sharply with seniority. A departing frontline worker costs a fraction of what an executive departure does.11. Frontline and hourly workers cost approximately 40% of their annual salary to replace.
12. According to Gallup, technical and professional roles cost approximately 80% of annual salary to replace.
13. Besides, leaders and managers cost approximately 200% of their annual salary to replace.
14. Center for American Progress reports that low-paying, high-turnover jobs (under $30,000/year) cost 16% of annual pay to replace.
15. Midrange positions (around $40,000/year) cost 20% of annual pay to replace.
16. Senior executives in highly educated roles cost up to 213% of annual pay to replace.
17. Hiring for executive positions costs roughly 7 times more per hire than non-executive roles, per SHRM.
| Role level | % of salary | At $50K salary | At $100K salary | At $200K salary |
|---|---|---|---|---|
|
Frontline/hourly |
~40% |
$20,000 |
$40,000 |
$80,000 |
|
Technical/professional |
~80% |
$40,000 |
$80,000 |
$160,000 |
|
Manager/leader |
~200% |
$100,000 |
$200,000 |
$400,000 |
Employee turnover cost by industry
Turnover costs and rates vary dramatically across sectors. Healthcare and hospitality carry the highest per-departure costs, while construction and transportation face the highest turnover rates.Healthcare turnover cost statistics
Healthcare has the highest dollar-per-departure cost of any frontline industry. Nursing turnover alone costs hospitals millions per year. The latest NSI Nursing Solutions data reveal the true cost of healthcare turnover.18. The average cost to replace one staff RN is $60,090.
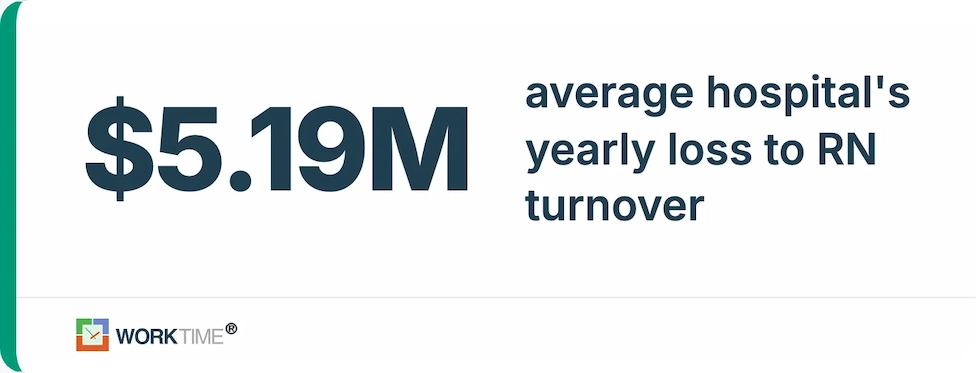
19. The average hospital loses $4.2 million to $6.2 million a year to RN turnover alone, with the average loss landing at $5.19 million.
20. The national RN turnover rate is 17.6%, a 1.2 percentage point increase year-over-year.
21. Each percentage point change in RN turnover costs or saves the average hospital $295,000 per year.
22. Nurses with under one year of service account for 29% of all RN separations. Separately, 22.7% of newly hired RNs leave within their first year.
23. Overall hospital staff turnover is 18.5% nationally, with 94.9% of separations being voluntary.
24. Replacing a physician costs $500,000 to more than $1 million, or 2 to 3 times the physician's annual salary.
25. According to , physician burnout costs the US healthcare system $4.6 billion per year.
Technology turnover cost statistics
Tech retention has eroded steadily over the past decade, and engineering is the function companies hold onto longest.26. According to SignalFire, four-year engineering retention at major tech companies declined from 59% to 52% between 2015 and 2024.
27. Ravio reveals that European tech attrition is 17.4% overall. Engineering has the lowest attrition of any function at 12%.
Hospitality and food service turnover statistics
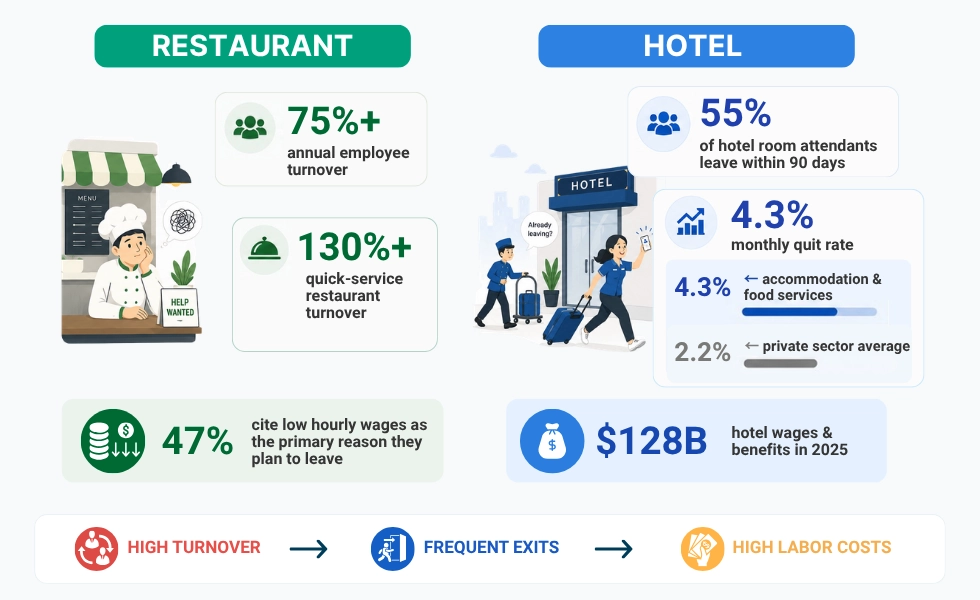
Hospitality has the highest turnover rate of any major industry. Quick-service restaurants regularly exceed 100% annual turnover.28. Annual restaurant employee turnover exceeds 75% overall. Quick-service restaurants frequently exceed 130%.
29. The monthly quit rate in accommodation and food services is 4.3%, nearly double the 2.2% private-sector average, per National Restaurant Association/BLS JOLTS.
30. OysterLink reports that 55% of hotel room attendants leave their job within the first 90 days.
31. About 50% of restaurant employees cite low hourly wages as the primary reason they plan to leave.
32. In 2025, wages and benefits accounted for almost $128 billion in U.S. hotel industry spending, with the figure projected to climb to about $131 billion in 2026, per the American Hotel and Lodging Association.
Retail turnover statistics
Retail carries some of the highest total churn of any sector, driven by seasonal workforce cycling on top of ordinary quits.33. Retail separations totalled 45.4% of employment in 2025, down from 48.0% in 2024. This counts all separations, including layoffs and retirements, summed across the twelve months.
34. According to Mercer, retail and wholesale voluntary turnover is 26.7%, the second-highest rate among industries tracked.
Construction turnover statistics
Construction turnover is driven by project-based employment and seasonal cycles, on top of a hiring shortfall the industry has not closed.35. Construction separations totaled 48.1% of employment in 2025, with quits alone accounting for 21.2%. The gap between those two figures is the layoff and project-completion churn that is structural to the industry, per BLS.
36. According to Associated General Contractors, 92% of construction firms that are hiring report difficulty finding qualified workers.
37. Notably, 82% of construction firms struggle to fill hourly craft positions, and 80% struggle with salaried openings, a higher share than at any point in the past three years.
38. According to Associated Builders and Contractors, the construction industry needs to attract 349,000 net new workers this year, and 456,000 the year after.
39. The Construction Industry Institute reports that each 10% increase in turnover results in a 2.5% increase in total project labor costs, per the Construction Industry Institute's model plant analysis.
This is the industry's landmark turnover-cost study, published in 1999 and still the most cited figure of its kind.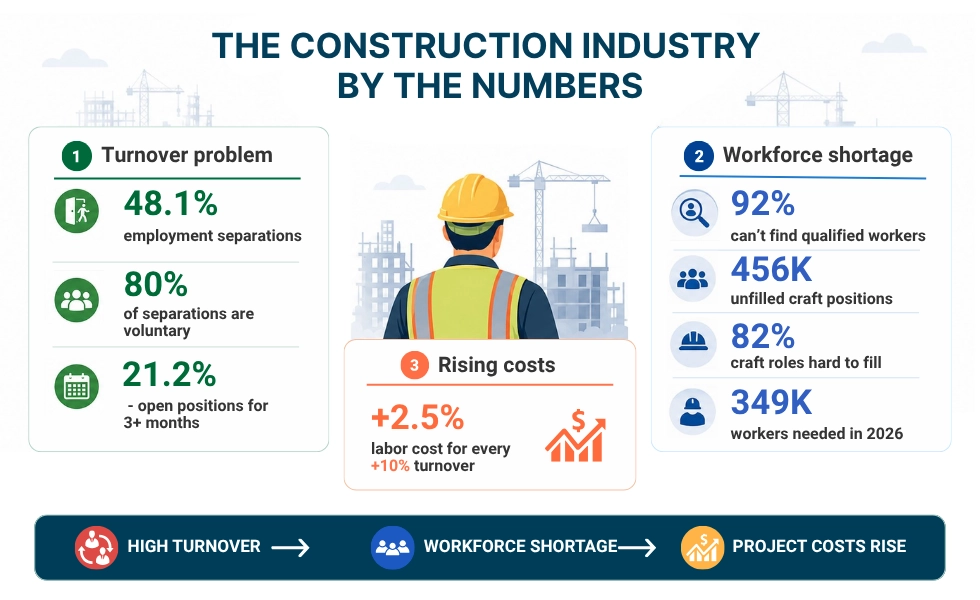
Manufacturing turnover statistics
Manufacturing faces a long-term talent gap. Nearly half of the projected workforce needs through 2033 could go unfilled.40. According to Deloitte/UKG Workforce Institute, replacing one skilled manufacturing frontline worker costs $10,000 to $40,000. 60% of HR leaders surveyed reported costs in this range.
41. The Manufacturing Institute/Deloitte reveal that 3.8 million new manufacturing employees are needed by 2033. And 1.9 million of those positions could go unfilled.
42. More than 67% of manufacturers cited the inability to attract and retain employees as their top business challenge, per the NAM survey.
43. Over 80% of manufacturing professionals reported that labor turnover disrupted production, per Deloitte.
Financial services turnover statistics
Financial services has among the lowest turnover rates of any industry, but the first year on the job is where it loses people.44. Finance industry turnover has settled at 5.6%, down from a peak of 9.7% in 2022-2023.
45. One-third (33%) of all new finance hires quit within their first year. First-year turnover rose from 26% for 2020 cohorts to 33% for 2024 cohorts.
46. Mercer reports that insurance and reinsurance voluntary turnover is 8.2%, the lowest among all industries tracked.
Transportation and logistics turnover statistics
Trucking has the most extreme turnover of any occupation. Large truckload carriers replace nearly their entire driver pool every year.47. Long-run driver turnover averages 92.7% at large truckload carriers and 77.6% at small ones, based on American Trucking Associations data spanning 1996 to 2023. Large carriers effectively replace their entire driver pool each year.
48. According to Transport Topics, the cost of losing a single truck driver is approximately $13,000.
Education turnover statistics
Teacher turnover carries a five-figure replacement cost per departure and compounds shortages that districts are already struggling to fill.49. The Learning Policy Institute reports that about 1 in 7 US public school teachers either move schools or leave teaching each year.
50. Replacing a teacher costs $11,860 in small districts, $16,450 in medium districts, and $24,930 in large districts in 2024.
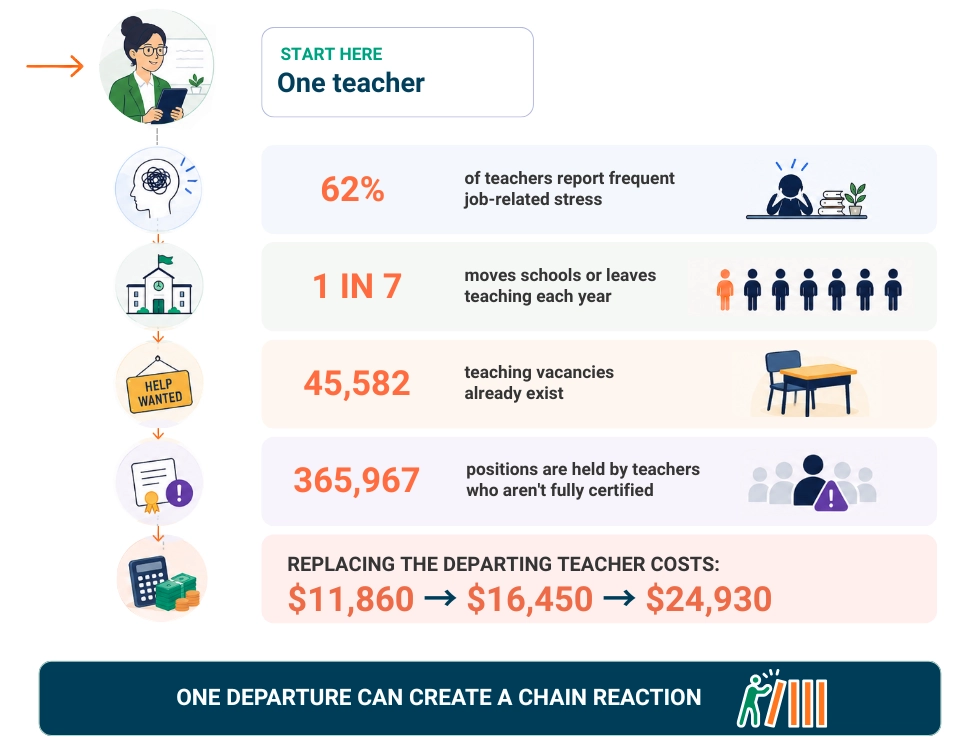
51. According to NEA/RAND, 62% of teachers report frequent job-related stress, nearly double the 33% rate among workers in other professions.
52. For the 2025-26 school year, 45,582 teaching positions are vacant, and another 365,967 are filled by teachers who are not fully certified, according to the Learning Policy Institute.
Government turnover statistics
Government has the lowest voluntary turnover of any broad sector but faces extreme hiring timelines and a workforce contraction.53. Government has the lowest quit rate of any major sector: 0.8% of employees leave per month, against 1.9% across all industries and 4.0% in leisure and hospitality.
54. Government positions take an average of 119 days to fill, more than three times the 36-day private-sector average.
55. The federal workforce shrank by approximately 256,000 employees (over 11%) from December 2024 to January 2026. Nearly 378,000 employees separated during 2025.
Year-over-year employee turnover trends
Turnover spiked during the Great Resignation, normalized by 2024, and is now showing signs of climbing again. Here’s what the U.S. Bureau of Labor Statistics (BLS) and Mercer data reveal.56. Significantly, 50.5 million US workers voluntarily quit their jobs in 2022, a record high.
57. Quits fell every year after the 2022 peak: 44.2 million in 2023, 39.3 million in 2024, and 38.0 million in 2025.
58. According to the Bureau of Labor Statistics (BLS), 3.1 million workers quit their jobs in May 2026, with the quit rate at 1.9%.
| Year | Annual quits (BLS JOLTS) |
|---|---|
|
2021 |
47.6 million |
|
2022 |
50.5 million |
|
2023 |
44.2 million |
|
2024 |
39.3 million |
|
2025 |
38.0 million |
| Year | US voluntary turnover rate (Mercer) |
|---|---|
|
2022 |
24.7% |
|
2023 |
17.3% |
|
2024 |
13.5% |
|
2025 |
13.0% |
60. The average cost of turnover per worker rose from $36,723 in 2025 to $45,236 in 2026, a 23% increase.
First-year attrition and onboarding cost statistics
The first year is the most vulnerable period for new-hire turnover. Losing an employee early effectively creates two costs: hiring them and hiring their replacement.61. According to Gallup, new hires take a median of 8.2 months to reach full productivity in mid-level roles. WorkTime 80+ reports give managers objective data to evaluate new hires during probation, track progress, and identify areas where additional support may be needed.
62. The average training cost per US employee is $1,254. Total US training expenditures reached $102.8 billion, with organizations investing 2.9% of revenue in learning and development, the highest share in five years.
Employee engagement and turnover statistics
Disengagement is the precursor to turnover. When employees mentally check out, the departure is already underway. Let’s explore the key findings from the Gallup survey.63. Only 21% of employees worldwide were engaged in 2024, down from 23% in 2023.
64. This drop in engagement translated into an estimated $438 billion in lost productivity in 2024.
65. Significantly, 62% of workers worldwide are "not engaged." Another 17% are "actively disengaged." These numbers show why engagement needs more than an annual survey. WorkTime helps managers spot changes in productivity, focus, attendance, and distraction levels, providing earlier signals when engagement starts to decline.
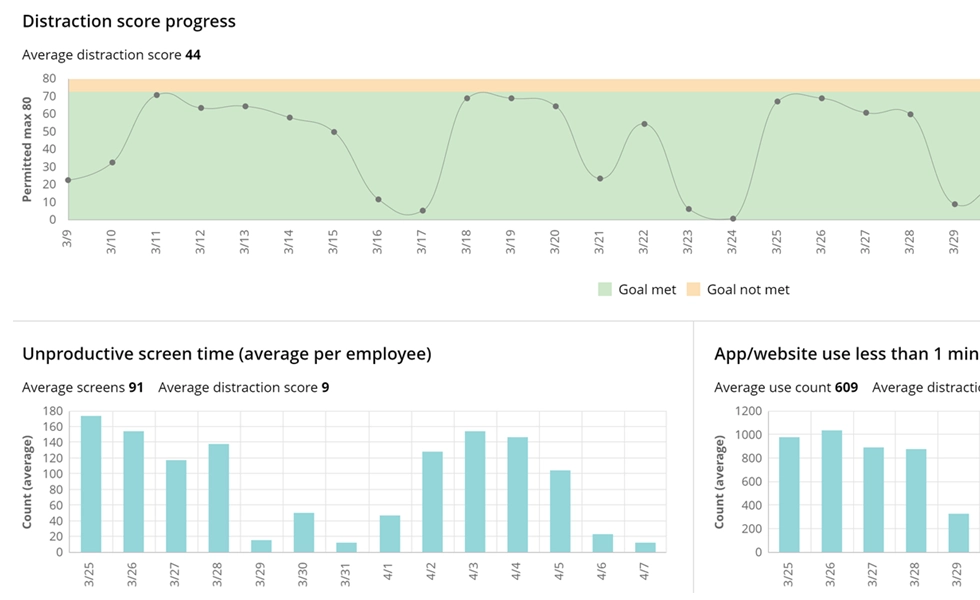

See how distraction trends can impact employee engagement and productivity. Identify patterns & strengthen focus!
Start free trial66. Manager engagement fell from 30% to 27%, a sharper drop than any other employee segment.
67. Burned-out employees are 2.6 times as likely to be actively seeking a different job. 23% of employees feel burned out very often or always, and another 44% sometimes.
68. Workplace stress is responsible for approximately 40% of US employee turnover.
69. More than half of U.S. employees (51%) are keeping an eye out for a new job or actively looking. Among Gen Z, the figure climbs to 61%.
Why employees leave: Turnover prevention statistics
The majority of departures are preventable. The data points to management quality, pay, and career development as the primary drivers.70. Notably, Work Institute finds that 75% of voluntary employee departures are preventable.
71. Gallup reports that 42% of employees who voluntarily left say their manager or organization could have prevented their departure.
Valuable employee retained!
Industry
IT
Employees
100
WorkTime spotted job-search activity and overtime, giving the manager time to act - and retain a key employee. A resignation risk turned into a retention win!
Read more
72. According to Gallup, 51% of departing employees say no leader spoke to them about their job satisfaction or future in the three months before they left.
73. According to Express Employment Professionals/Harris Poll, 32% of departures are attributed to better pay and benefits elsewhere.
74. What’s more, 37% of hiring managers cite increased workplace demands leading to more vacancies.
75. The Work Insitute reports that management-related turnover hit a six-year high.
Conclusion
Employee turnover costs more than most organizations measure. The headline numbers are severe: $1 trillion in annual losses across the US economy, a per-departure average that now exceeds $45,000, and industry-specific costs that run into the hundreds of thousands per event in healthcare and executive roles. But the deeper pattern across these statistics is that the majority of departures are preventable. The data consistently shows that management quality, career development, and early intervention drive retention far more than compensation alone. The organizations that reduce turnover are the ones that detect disengagement before it becomes a resignation. WorkTime provides non-invasive employee monitoring that surfaces early warning signs, including shifts in active and idle time, attendance pattern changes, and productivity trends, so HR and management teams can act before a departure becomes a line item. To see how WorkTime identifies retention risks across your workforce, start a free trial.