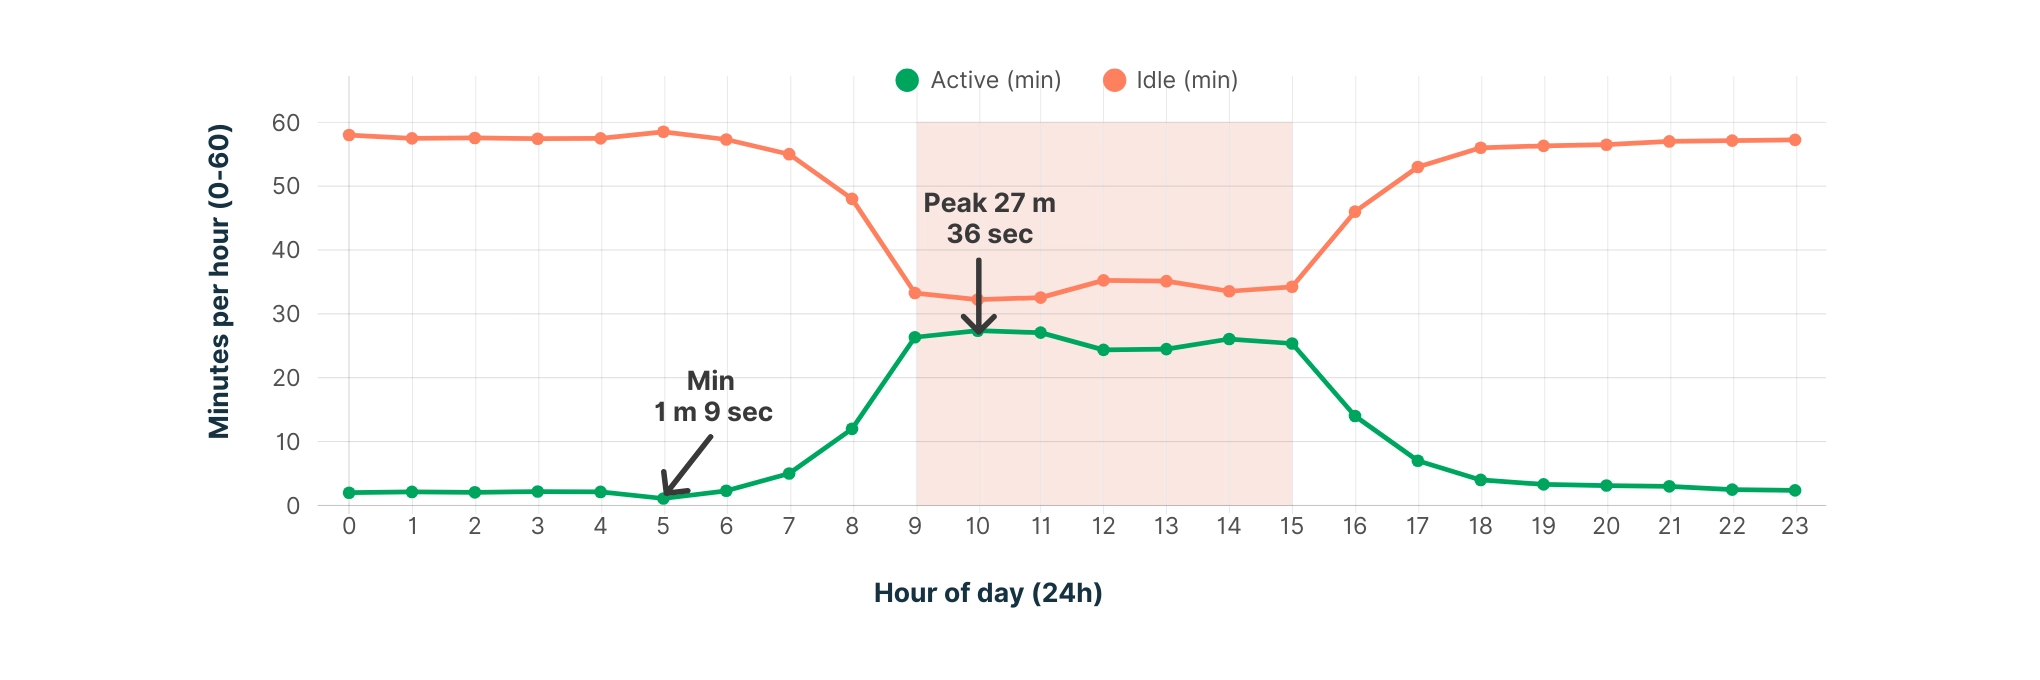
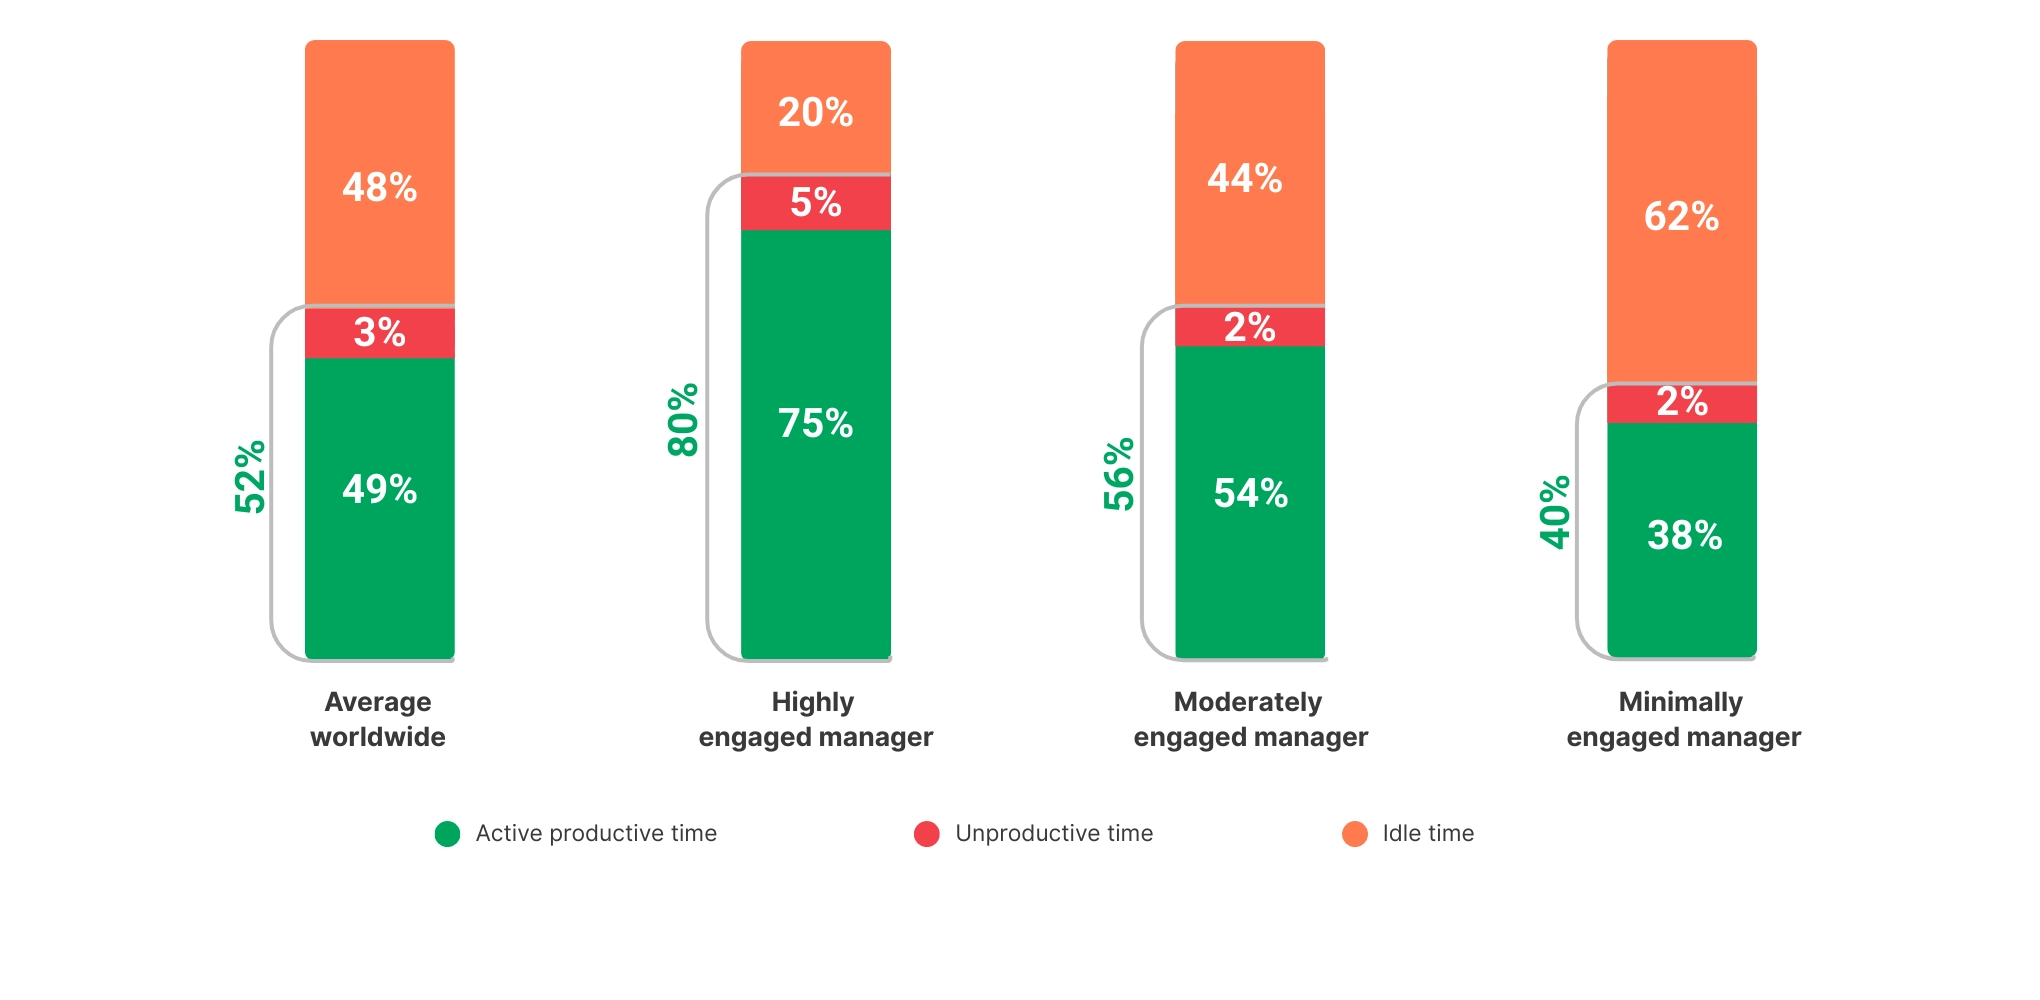
As the research shows, an average office employee using computers is active for about 80% of the working day. However, these numbers can vary significantly depending on management style and how managers leverage employee monitoring to optimize productivity and engagement.
Highly engaged managers
Highly engaged managers view productivity monitoring reports as a powerful tool for both communication and continuous improvement. Rather than just analyzing the numbers, these managers actively share the reports with their teams, discussing performance on a regular basis.
The diagram below illustrates the results achieved by a highly engaged manager.
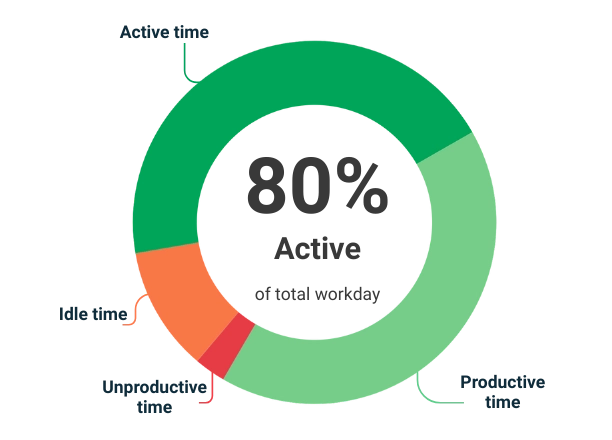
This company shows performance results way above average because of the manager being highly involved with the team and actively shares performance reports:
- Active time: 80% (5 h 40 min per employee on average)
- Productive time: 75%
- Unproductive time: 5%
- Idle time: 20%
Employees in this team actively use their computers for 80% of the working day on average. This active time is split into 75% spent on productive activities and 5% on unproductive activities.
On average, 20% of the working day is spent with computers on but not in use, known as idle time. This idle time may include breaks, offline meetings, or other on-computer-based activities.
Moderately engaged managers
Moderately engaged managers might regularly review productivity reports but rarely discuss the results with their teams. In many cases, employees are given access to their own reports to self-assess performance.
The diagram below illustrates the results achieved by a moderately engaged manager.
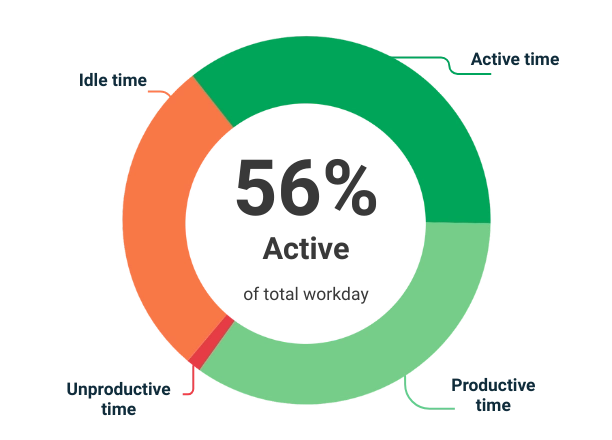
This company shows performance results way above average because of the manager being highly involved with the team and actively shares performance reports:
- Active time: 56% (4 h 30 min per employee on average)
- Productive time: 54%
- Unproductive time: 2%
- Idle time: 44%
Employees in this team actively use their computers for 56% of the working day on average. This active time is split into 54 spent on productive activities and 2% on unproductive activities.
On average, 44% of the working day is spent with computers on but not in use, known as idle time. This idle time may include breaks, offline meetings, or other on-computer-based activities.
Minimally engaged managers
Minimally engaged managers may occasionally review productivity reports but seldom discuss the findings with their teams. Instead, they tend to focus on identifying negative trends and addressing issues only when performance problems arise. In such environments, employees typically do not have access to their own reports for self-assessment.
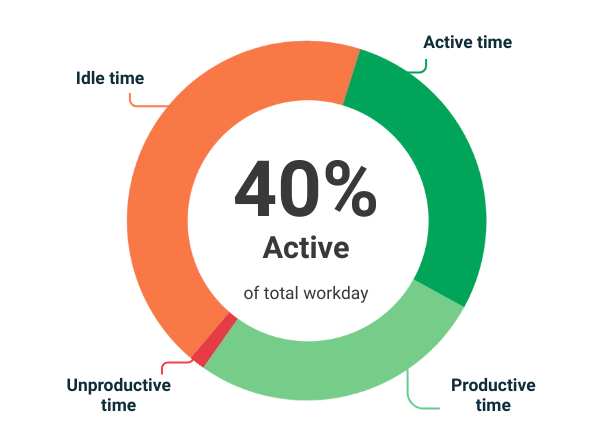
The diagram below illustrates the results achieved by a minimally engaged manager.
- Active time: 40% (3 h per employee on average)
- Productive time: 38%
- Unproductive time: 2%
- Idle time: 62%
This company shows performance results way above average because of the manager being highly involved with the team and actively shares performance reports:
Employees in this team actively use their computers for 40% of the working day on average. This active time is split into 38% spent on productive activities and 2% on unproductive activities.
On average, 62% of the working day is spent with computers on but not in use, known as idle time. This idle time may include breaks, offline meetings, or other on-computer-based activities.