WorkTime research 2026


Computer based analytics

100% anonymized and privacy-compliant

By WorkTime
non-invasive monitoring

26+ years of experience
in employee monitoring


This study is part of the WorkTime Research 2026 series - an ongoing set of reports focused on how employee time is actually used in modern workplaces.
The research examines computer-based overtime only, analyzing work activity that takes place outside standard working hours.
The analysis covers the period 2024–2025 and is based on anonymized, aggregated global data collected across multiple industries and regions.
Offline overtime activities - such as meetings, phone calls, or other non-computer-based work - are not included in this report and will be addressed in a separate upcoming study.
WorkTime provides workforce analytics to thousands of companies and hundreds of thousands of employees worldwide, providing broad data for identifying workplace trends across industries and regions.
Privacy is maintained throughout the research process. All WorkTime Research data is 100% anonymized and aggregated, with no employees, companies, or personal information identified.

Study period
January 2024 – December 2025

Countries analyzed
Australia, Canada, India, South Africa, UK, USA

Data source
WorkTime customers across multiple industries

Data safety
100% anonymized and privacy-compliant

Global reach
Thousands of companies
Hundreds of thousands of employees

Overtime is measured as computer activity outside scheduled work hours.
This category captures computer activity that occurs beyond an employee’s scheduled working hours. It reflects actual overtime work rather than contractual hours, showing when employees continue working outside the expected time frame.
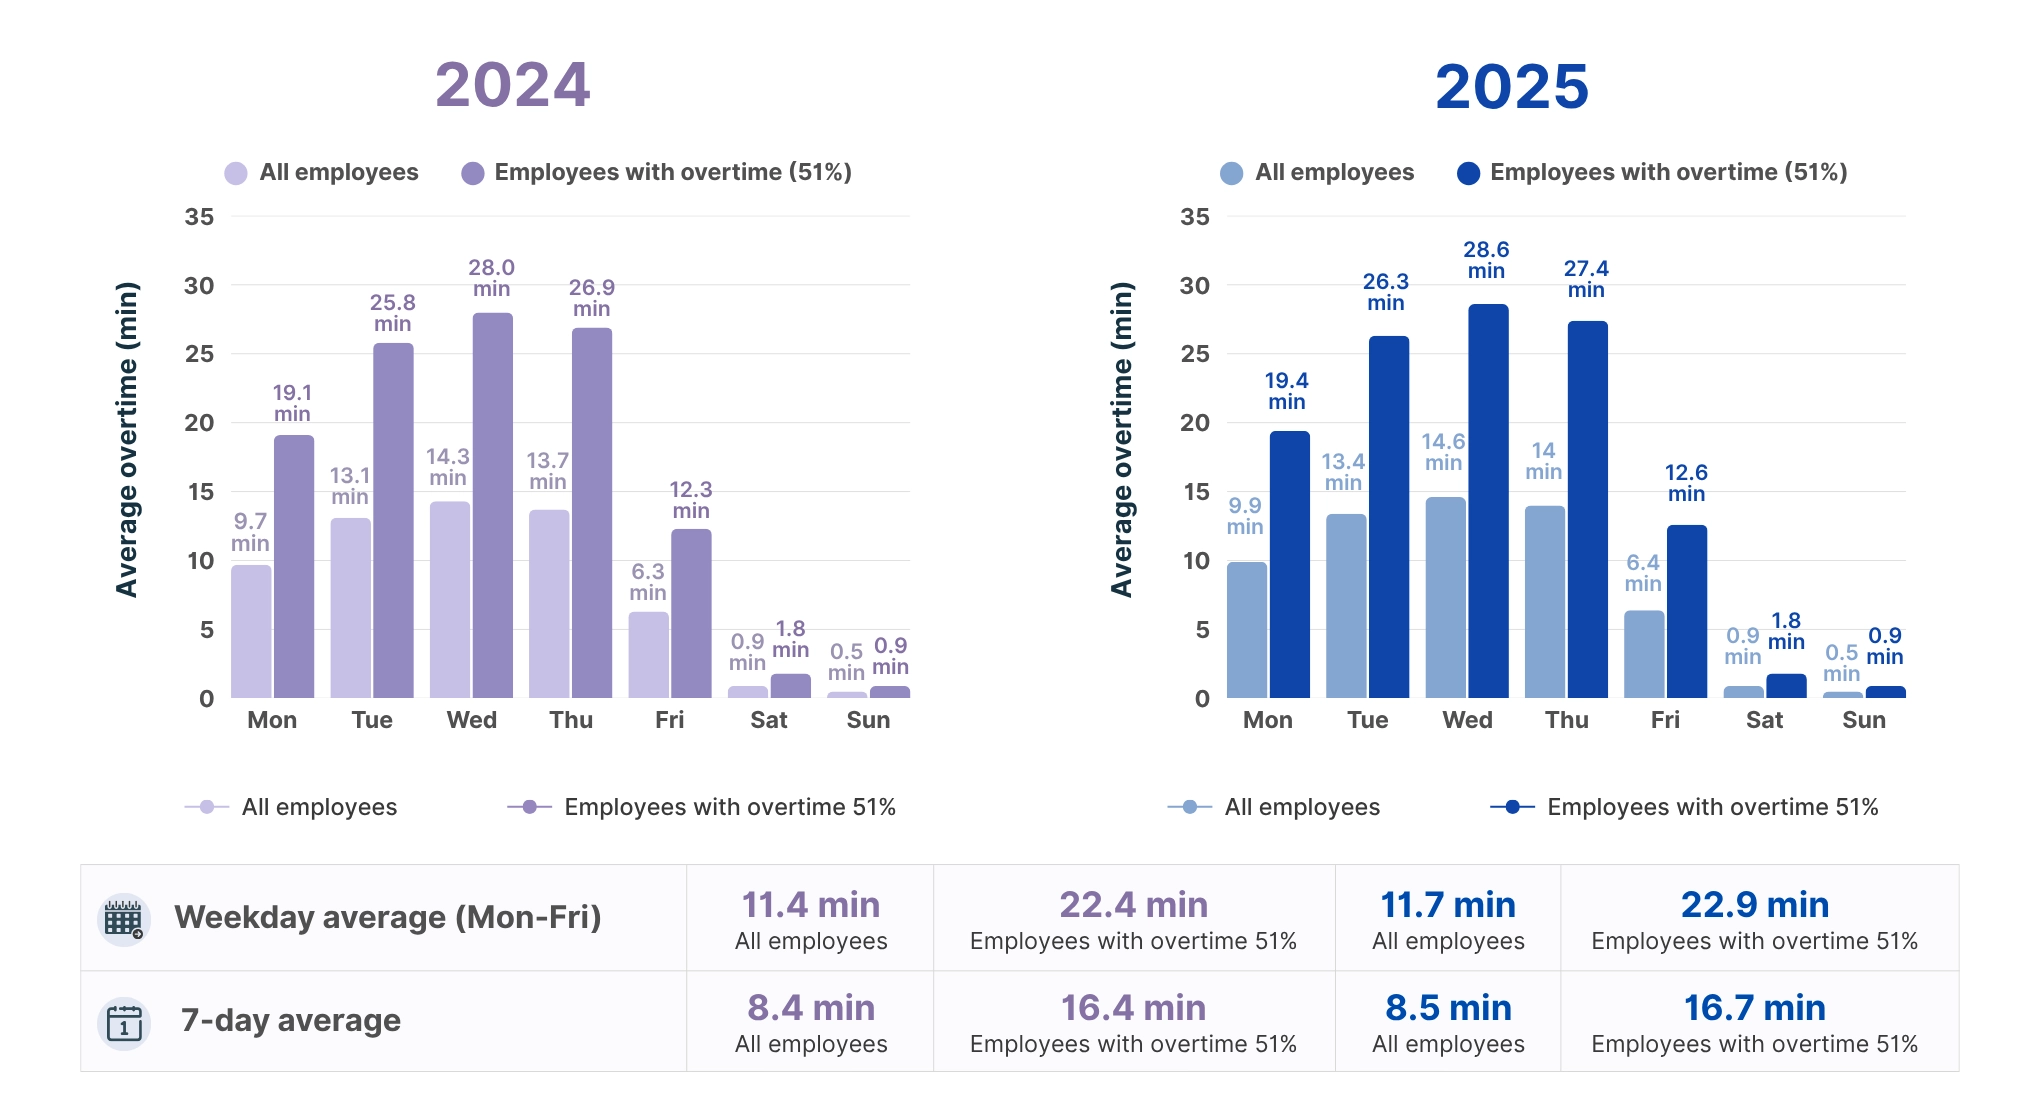
The study analyzes overtime occurring before the start of the workday, after regular hours in the evening, and during weekends. This helps identify when extended work most often takes place and whether overtime is distributed evenly or concentrated in specific time windows.
Overtime is examined across different time scales to reveal recurring patterns. Daily data shows short-term behavior, weekly trends highlight workload accumulation, and monthly analysis helps identify sustained overtime and long-term pressure.
This metric shows how overtime is distributed within non-working hours. It highlights whether after-hours work is spread out or clustered around specific periods, such as late evenings or early mornings, indicating potential workload imbalance or operational inefficiencies.


More hours do not equal better results.

Frequent overwork indicates systemic issues.

Sustained late work raises exhaustion and turnover.

High overtime can indicate poor leadership practices.
Overtime is not an achievement - it is an operational signal.
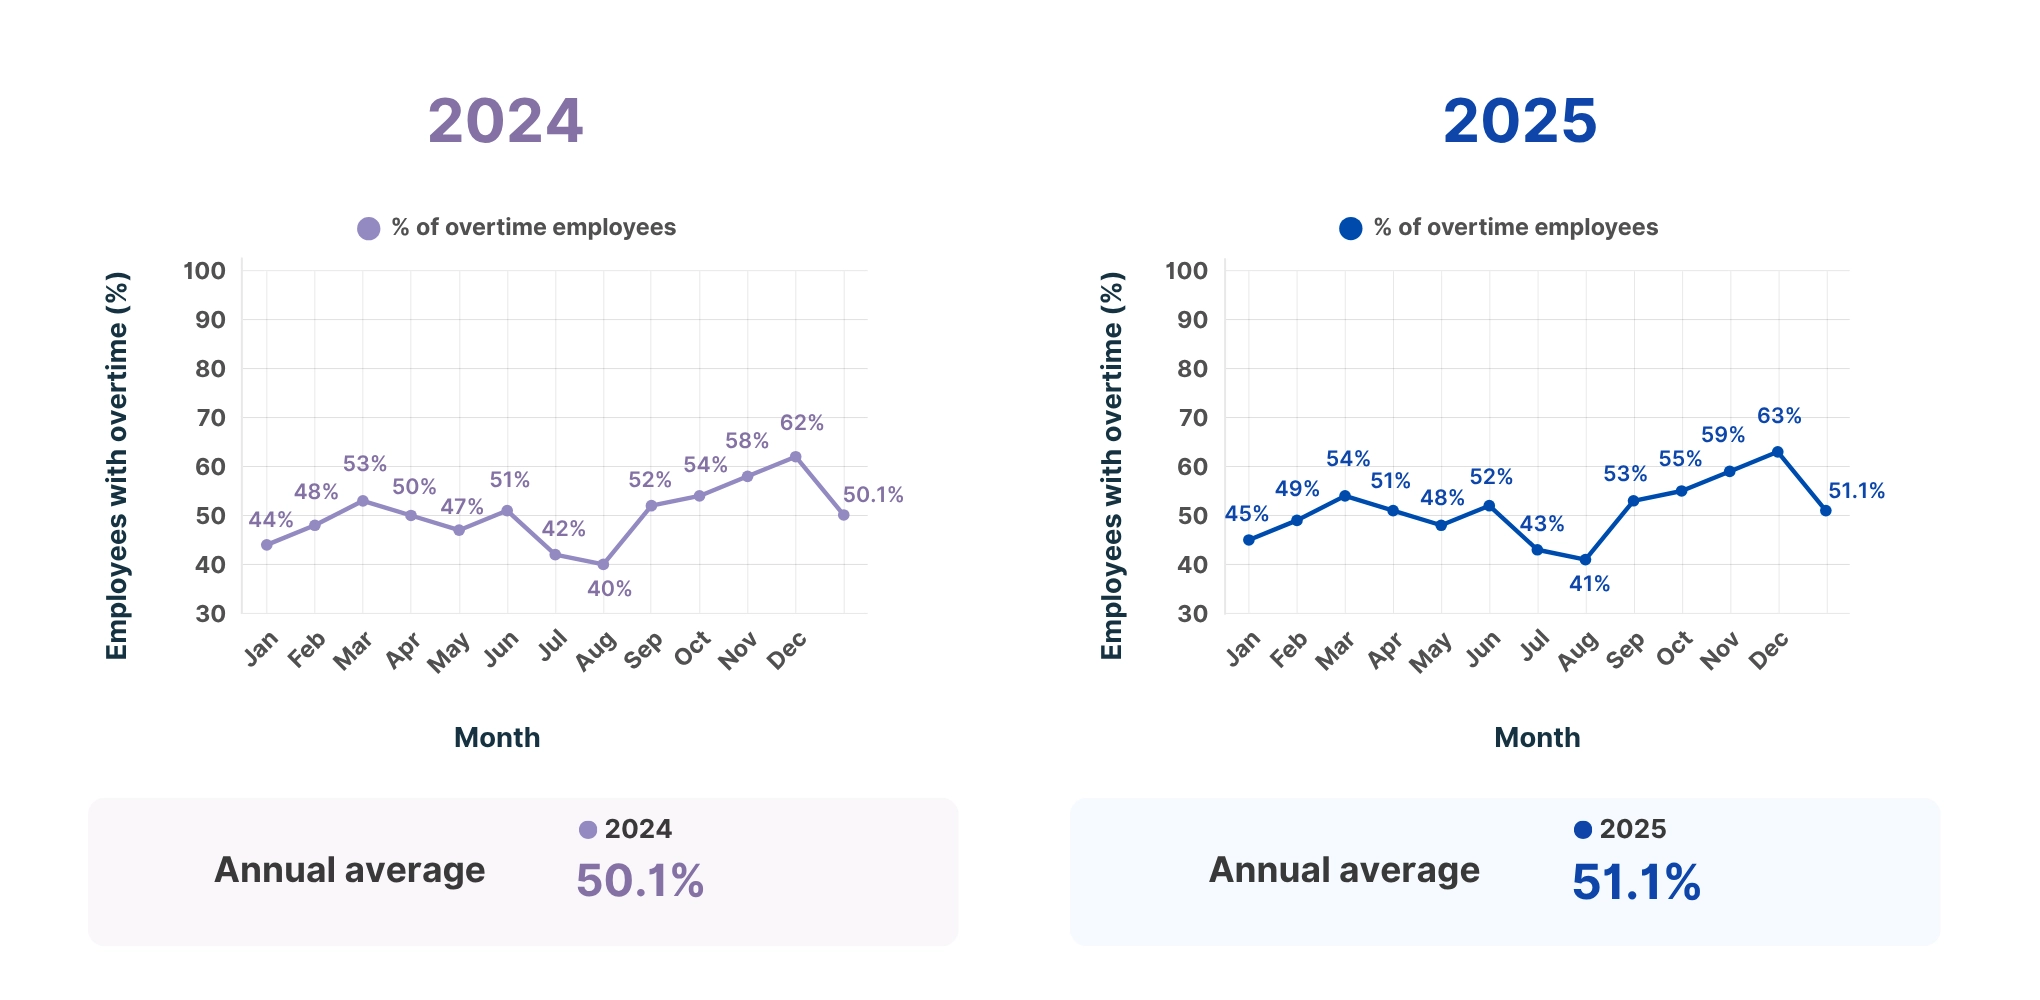
51%
Employees show computer activity outside standard working hours on a regular basis.

Evenings & weekends
Most overtime occurs in late evenings and during weekends.

Overtime ≠ productivity
Extended hours do not correlate with higher productive output.

Chronic overtime
Persistent after-hours work points to planning and resource issues.

Management matters
Teams with highly engaged managers show healthier overtime distribution and less unproductive after-hours work.


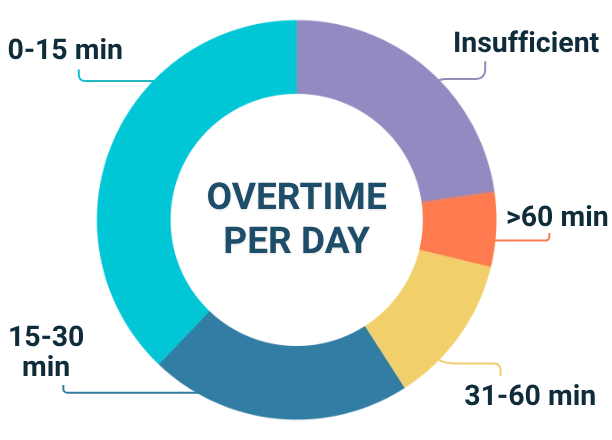
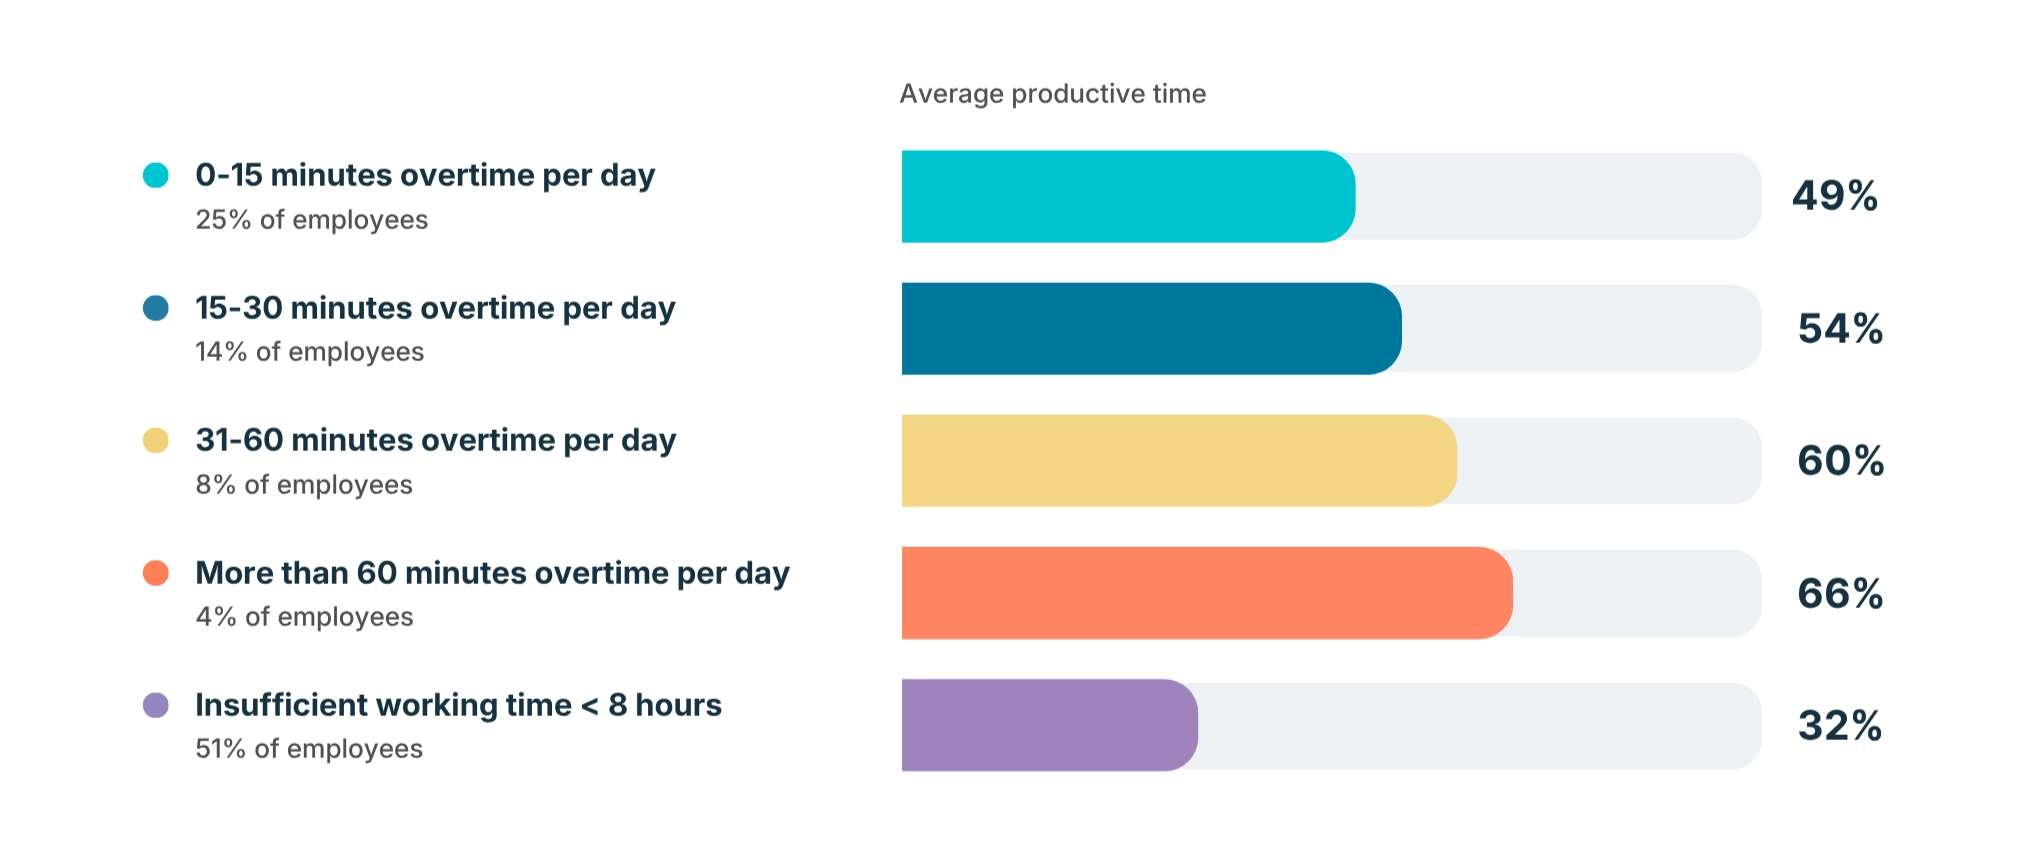
Overtime is not uniform across the workforce. A significant share of employees spend less than 15 minutes per day working outside standard hours, indicating occasional or situational overtime rather than sustained pressure.
At the same time, a smaller but clearly identifiable group of employees works 15–30 minutes, 31–60 minutes, or more than 60 minutes of overtime per day. While these groups represent a minority, they account for a disproportionate share of total overtime hours.
Employees with over 30 minutes of daily overtime tend to show recurring after-hours activity rather than isolated incidents. This pattern suggests structural workload concentration, where extended hours become part of the routine instead of a temporary adjustment.


| Time | Australia | Canada | India | South Africa | UK | USA |
|---|---|---|---|---|---|---|
| Before hours |
36% |
38% |
42% |
45% |
35% |
40% |
| Lunch |
34% |
36% |
40% |
43% |
33% |
37% |
| After hours |
40% |
42% |
46% |
49% |
39% |
44% |
| Weekends |
36% |
38% |
42% |
45% |
35% |
40% |
| Key insight | South Africa shows the highest overtime levels across all time periods, with after-hours work reaching 49%. |

| Employees | ||||
|---|---|---|---|---|
| Time | 1-50 | 51–200 | 201–1000 | 1000+ |
| Before hours |
36% |
38% |
41% |
43% |
| Lunch |
33% |
35% |
38% |
40% |
| After hours |
40% |
42% |
45% |
47% |
| Weekends |
35% |
37% |
40% |
42% |
| Key insight | Larger companies show more overtime, with after-hours work reaching 47% among companies with 1,000+ employees. |

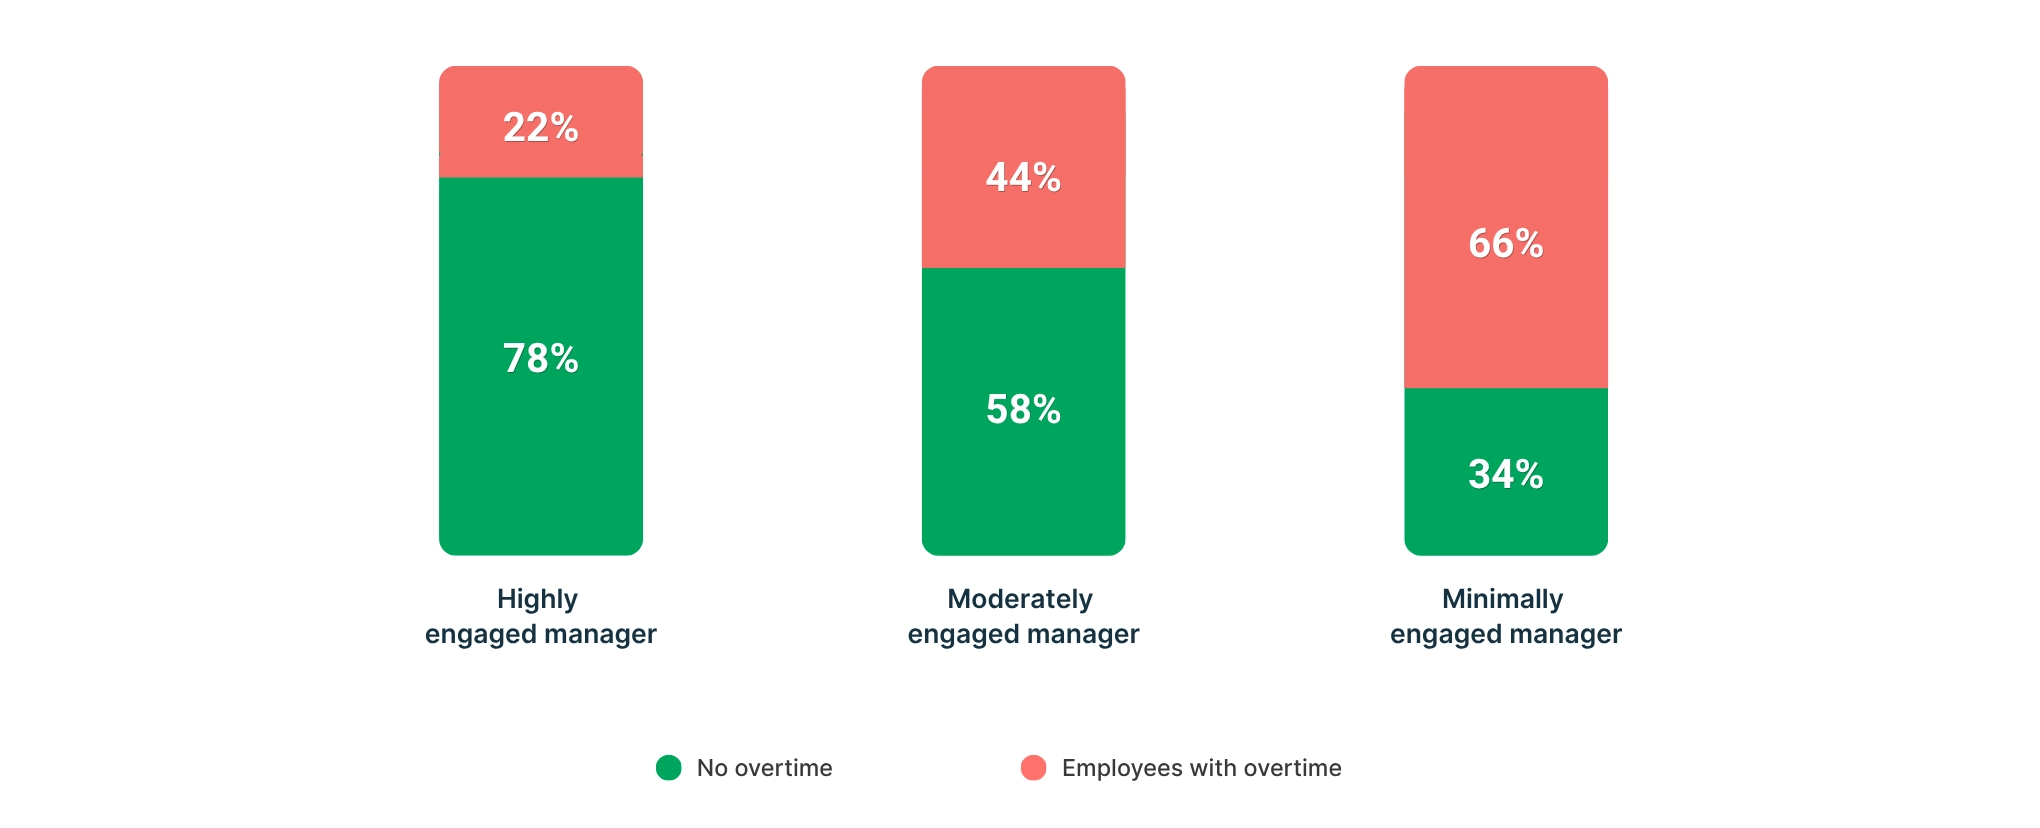
Overtime is not just an employee behavior. It is often a management outcome. The charts below compare typical overtime patterns under three different management styles, making it easy to see how manager engagement influences overtime.
Each chart shows the typical overtime pattern under a different management style, making it easy to compare the impact of manager engagement.
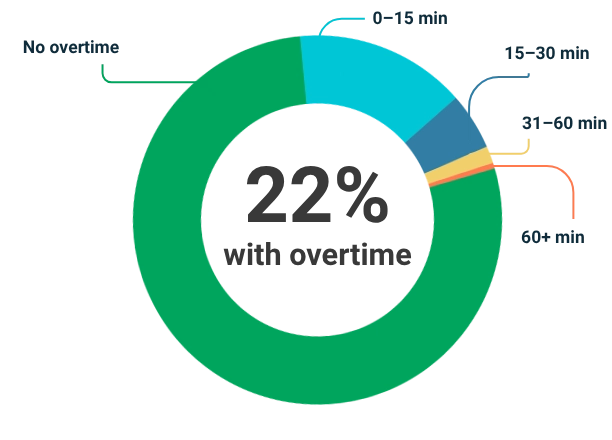
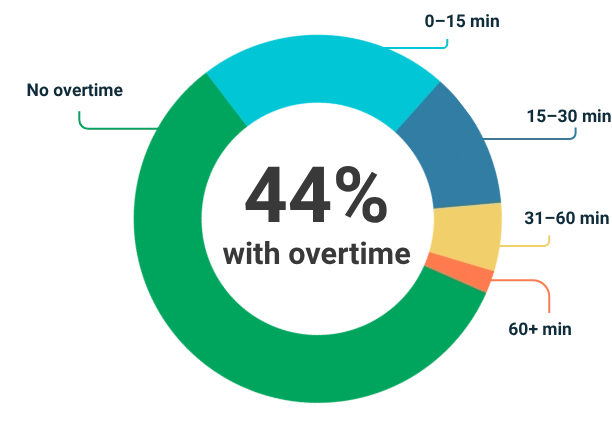
Highly engaged managers use overtime reports to identify workload imbalances early and keep overtime under control.
The chart below illustrates the overtime patterns typically seen under a highly engaged manager.

Regular reviews help managers identify workload imbalances early, keeping overtime low and preventing burnout and unnecessary labor costs.
Most employees finish their work within scheduled hours. When overtime occurs, it is usually brief, indicating that workload imbalances are identified and addressed early.
Consistent workload monitoring helps managers resolve issues before overtime becomes a recurring problem.
Moderately engaged managers review overtime reports from time to time but do not consistently act on emerging workload trends. As a result, overtime is generally under control, although some employees regularly work beyond their scheduled hours.
Typical overtime patterns under a moderately engaged manager are shown below.

This team experiences moderate levels of overtime because workload reviews are less consistent and adjustments are often made only after overtime begins to increase.

Most employees still finish within scheduled hours, but overtime becomes noticeably more common than under highly engaged managers. Short overtime periods increase, and a growing share of employees exceed 30 minutes of overtime.
More frequent workload reviews could reduce overtime further and improve work-life balance across the team.
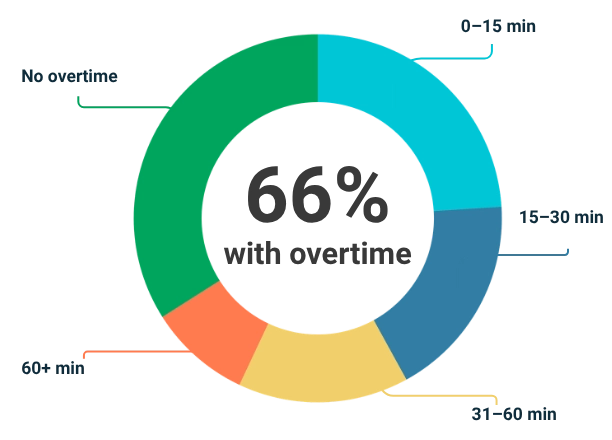
Minimally engaged managers review overtime reports only occasionally and typically respond only after workload issues become visible. Without regular monitoring and timely action, overtime gradually becomes a normal part of the workday for many employees.
The following chart shows how overtime typically develops under a minimally engaged manager.

This team experiences consistently high overtime because workload imbalances remain unresolved for extended periods and corrective actions are often delayed.

Overtime becomes a regular part of the workday rather than an exception, with a much larger share of employees accumulating 30 minutes or more of overtime, increasing both burnout risk and unnecessary labor costs.
Without regular workload reviews, overtime gradually becomes the norm rather than the exception, increasing both burnout risk and labor costs.

This chart shows that overtime is most common under minimally engaged managers.



Overtime does not always result in lower measured productivity. When employees work extended hours using productive applications, total productive time naturally increases.

However, this increase reflects longer exposure to work tools, not higher efficiency. Overtime inflates productivity metrics by adding more hours, not by improving output per hour or work quality.
Sustained overtime should therefore be interpreted as a capacity and workload signal, not a performance achievement. When productivity growth is driven primarily by longer hours, it raises concerns about sustainability, burnout risk, and dependency on extended work rather than process optimization.
Overtime can inflate productivity metrics - but it does not indicate healthier or more efficient work.
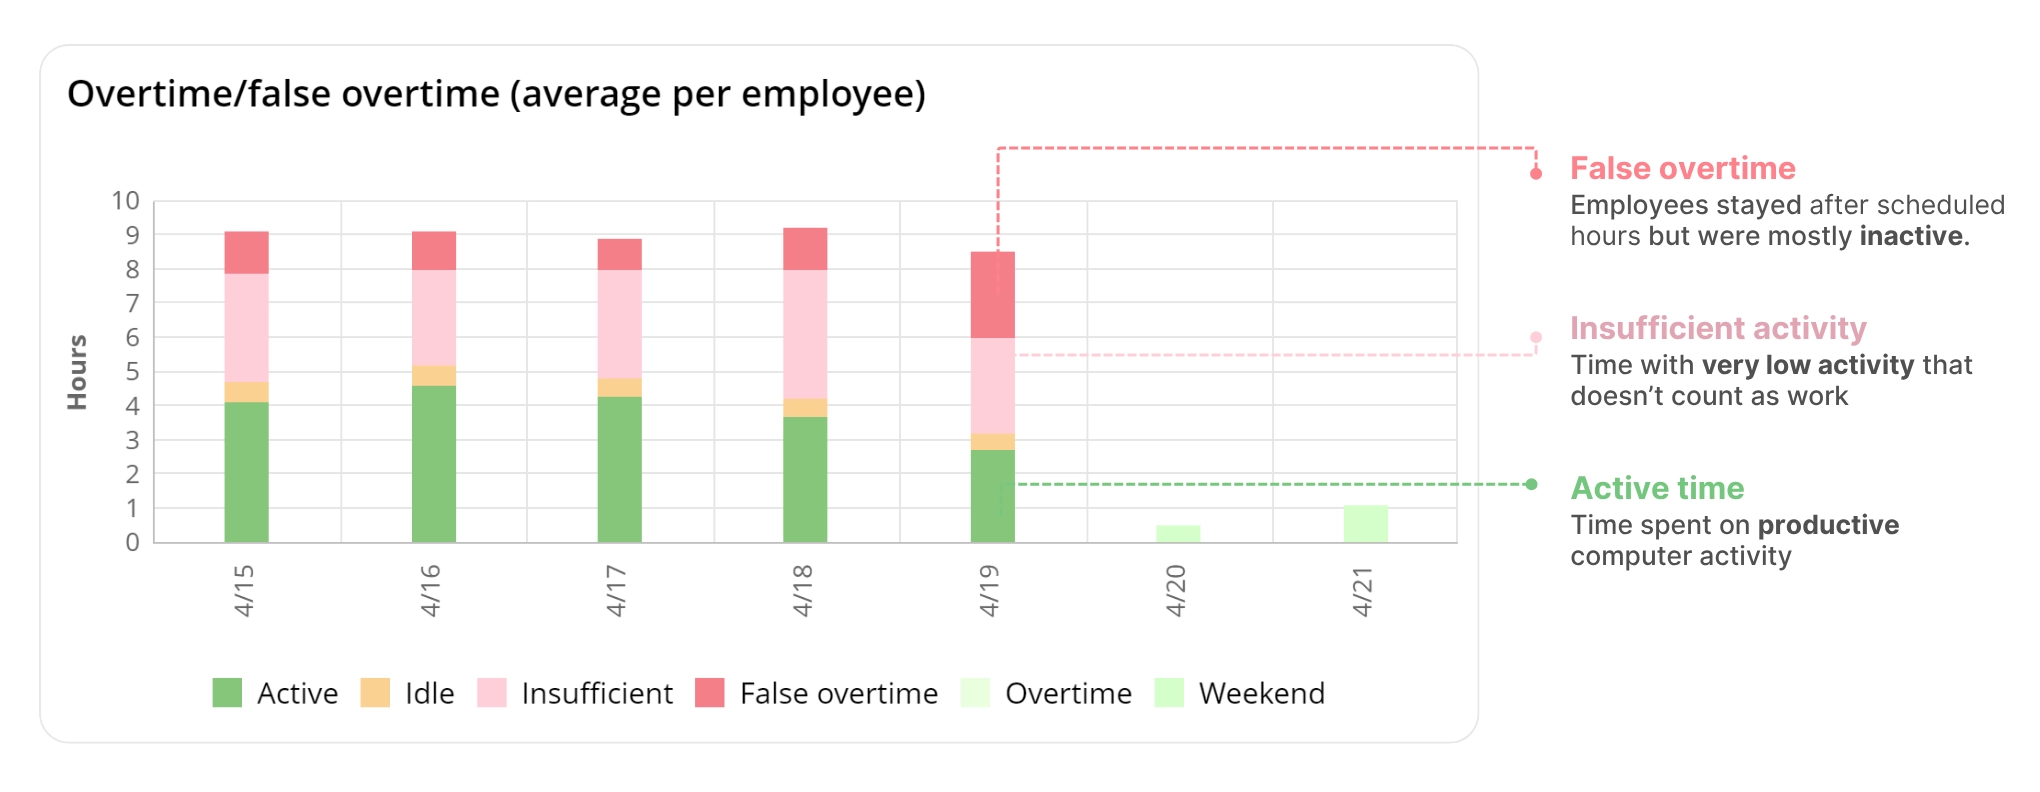
At first glance, this looks like overtime. However, the WorkTime report tells a different story. Much of these extra hours are actually classified as false overtime, meaning employees stayed after scheduled hours but spent much of that time inactive instead of working.


Who we are
We are a productivity monitoring software company with a strong focus on employee privacy and data protection. We call our approach socially responsible, green employee monitoring - because productivity insights should never come at the cost of trust.
With over 26+ years of expertise, WorkTime has been at the forefront of ethical monitoring practices, helping organizations worldwide improve efficiency without invading privacy.

About the product
WorkTime® employee monitoring software and service is the flagship product of NesterSoft Inc., headquartered in Canada.
Launched in 1998, WorkTime remains the only non-invasive (“Green”) employee monitoring solution dedicated solely to productivity analysis. It ensures transparent, privacy-respectful monitoring designed for today’s hybrid and remote workplaces.

Compliance and security
WorkTime operates in full alignment with major global privacy standards:
Every feature is built to help organizations stay compliant while maintaining employee trust.

All research data is anonymized, aggregated, and processed in accordance with applicable privacy laws, including GDPR and other regional regulations.
Read our privacy policy
This research is based on anonymized, aggregated computer activity data collected through the WorkTime platform during 2024–2025.
The study analyzes computer-based work activity only. No personal or company-identifiable data is included.
See research methodology
When referencing this research, please cite as: WorkTime research 2026: overtime at work - global computer-based overtime analysis (2024–2025).

For quotes, data clarifications, or interview requests:
WorkTime research team
Overtime inflates productivity metrics by adding more hours, not by improving output per hour or work quality.